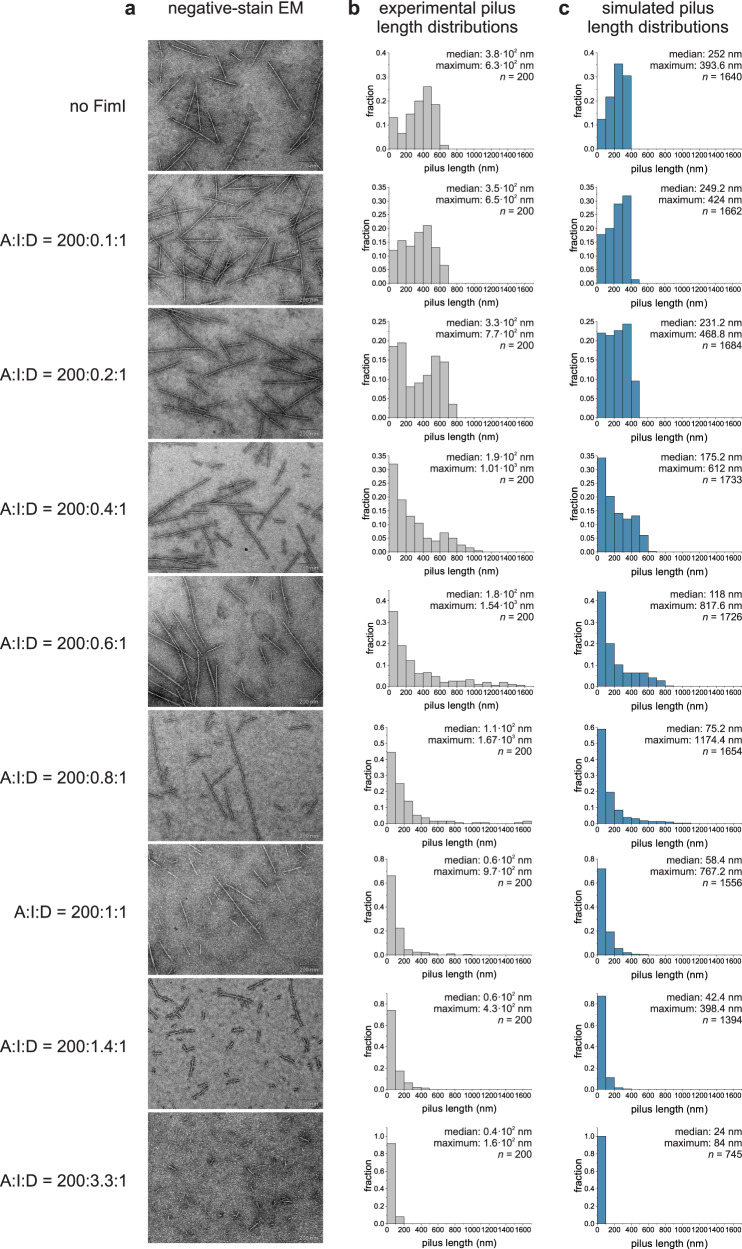
Fig. 3. FimI modulates pilus length: Experimental in vitro data versus simulations in silico.
a Representative negative-stain electron micrographs of samples taken from the pilus rod assembly reactions (Fig. 2c) after 65 min of incubation (scale bar = 200 nm). The ratios between FimCA, FimCI and FimD (A:I:D) are indicated on the left and refer to the total initial concentrations of the respective proteins, not taking into account that only 82% of the FimD molecules were catalytically active. b, c Length distributions of pili assembled in vitro (gray) and in silico (blue). Median, maximum and size n of each sample are indicated. Source data are provided as a Source Data file.

