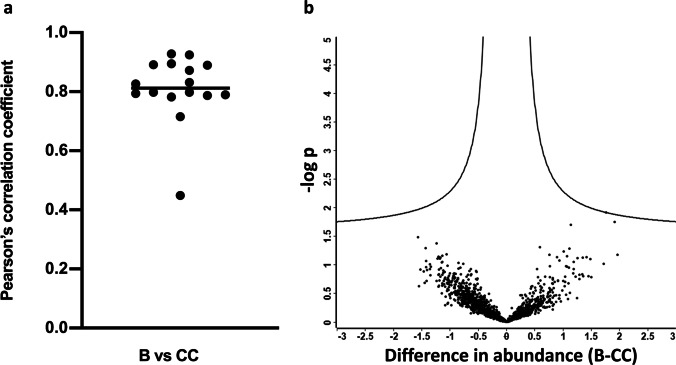
Fig. 3.
There is a high intraindividual correlation between urine bag and clean catch, with no significant markers differentiating the two methods. a Each dot represents a single patient. Pearson correlation coefficient between urine bag (B) and clean catch (CC) collection was calculated for all proteins within the samples of the patient with Perseus. Mean correlation coefficient was 0.81 ± 0.11 (mean ± SD). A perfect correlation would have a value of 1. b A volcano plot to identify proteins, which are different between bag urine (B) and clean catch urine (CC). Each dot represents a single protein. On the x axis, the difference between the two groups is plotted (B-CC). The y axis plots the statistical significance as − log p. Points above the curved lines would represent markers significantly different between the two collection methods

