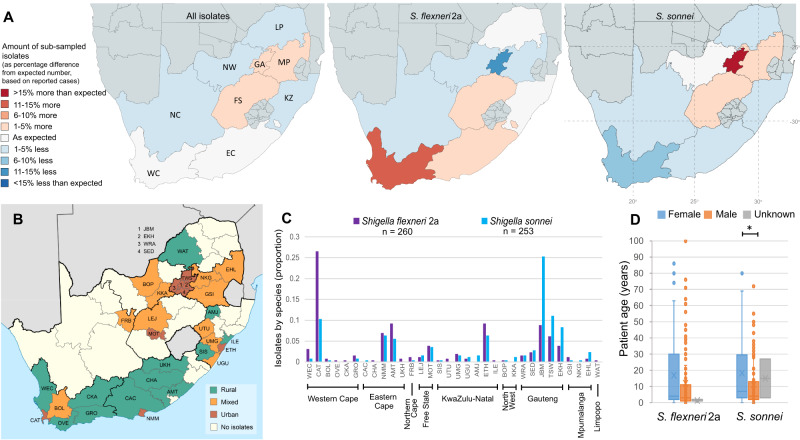
Fig. 1. Representativeness, and geographic and patient demographic features of the surveillance subsample.
A Provincial representation the surveillance cases within isolate subsample. The under or over representation of cases by sub-sampled isolates (, where O = actual number of sub-sampled isolates and E = expected number of isolates based on reported case numbers) is shown for all isolates (left), S. flexneri 2a (middle), and S. sonnei (right), coloured by percentage divergence from expected number of isolates based on reported cases, according to the inlaid key. NB: data are shown for 2011 to 2013 due to a lack of reported data from 2014 and 2015. Latitude and longitude are overlaid on S. sonnei map. B Urbanisation of sampled districts, level of urbanisation indicated by colour as shown in inlaid key (bottom right). C Proportion of subsample by district (x axis) and province (overlying horizontal bars) of origin and serotype (S. flexneri 2a = purple, S. sonnei = blue). D Distribution of patient ages among the surveillance subsample by Shigella serotype (x axis) and sex (female = blue and male = orange, unknown sex = grey). Data are presented as Box plots: S. flexneri 2a (male and female, respectively) minima = 0 and 0, maxima = 86 and 100, median = 3 and 4, IQR (bounds of box) = 1–11 and 2–30, whiskers = 23 and 63; S. sonnei (male and female, respectively) minima = 0, maxima = 80 and 72, median = 4 and 7, IQR (bounds of box) = 2–12.8 and 3–28.5, whiskers = 29 and 69.* = Mann–Whitney U (two-sided) p value = 0.007187, S. flexneri 2a male n = 128, female n = 129, and unknown sex = 3, S. sonnei male n = 129, female n = 122 and unknown sex = 2. WEC West Coast, CAT City of Cape Town, BOL Cape Winelands, OVE Overberg, CKA Central Karoo, GRO Garden State, CAC Sarah Baartman, CHA Chris Hani, NMM Nelson Mandela Bay, AMT Amathole, UKH Joe Gqabi, FRB Frances Baard, LEJ Lejweleputswa, MOT Manguang, SIS Harry Gwala, UTU uThukela, UMG uMhlanga, UGU =Ugu, AMJ Amajuba, ETH City of eThekwini, ILE iLembe, BOP Bojanala Platinum, KKA Dr. Kenneth Kaunda, WRA West Rand, SED Sedibeng, JBM City of Johannesburg, TSW City of Tshwane, EKH Ekurhuleni, GSI Gert Sibande, NKG Nkangala, EHL Ehlanzeni, WAT Waterberg. Maps in A were created using editable MapChart maps (https://www.mapchart.net/), edited and used according to the Creative Commons Attribution 4.0 International License (https://creativecommons.org/licenses/by-sa/4.0/). Map in B was adapted from image made available at Wikimedia Commons (https://commons.wikimedia.org/wiki/File:Map_of_South_Africa_with_district_borders_(2011).svg), and used in accordance to the Creative Commons Attribution 3.0 International License (https://creativecommons.org/licenses/by-sa/3.0/deed.en). Breakdown of isolate numbers are found in (A and C). Source data are provided as a Source Data file.

