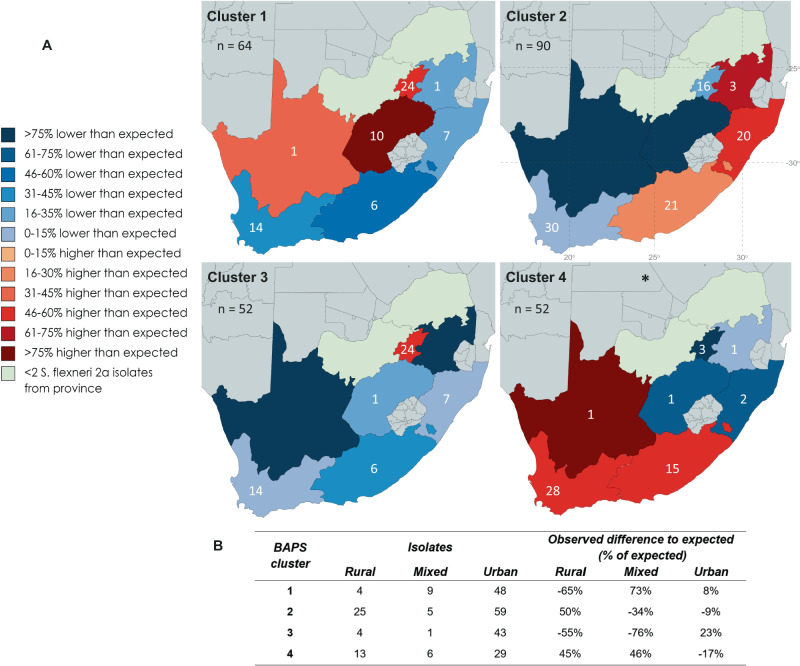
Fig. 3. Geographic distribution of S. flexneri 2a BAPS clusters within South Africa.
Each cluster has a distinct distribution by province across South Africa. A The under or over representation of each BAPS cluster by province based on the total number of isolates from each province; blue = fewer isolates than expected, red = more isolates than expected) (percentage difference determined using: , where O = actual number of cluster isolates and E = expected number of cluster isolates based on the total number of sample set isolates). Individually, Sf cluster 4 is statistically associated with Northern Cape, Western Cape, and Eastern Cape. Latitude and longitude are overlaid on BAPS cluster 2 map. B The presence of each cluster also varies by level of urbanisation, defined at the district level. * Fisher’s exact p value p = 0.0005. Source data are provided as a Source Data file. Maps in A were created using editable MapChart maps (https://www.mapchart.net/), edited and used according to the Creative Commons Attribution 4.0 International License (https://creativecommons.org/licenses/by-sa/4.0/). BAPS Bayesian analysis of population structure.

