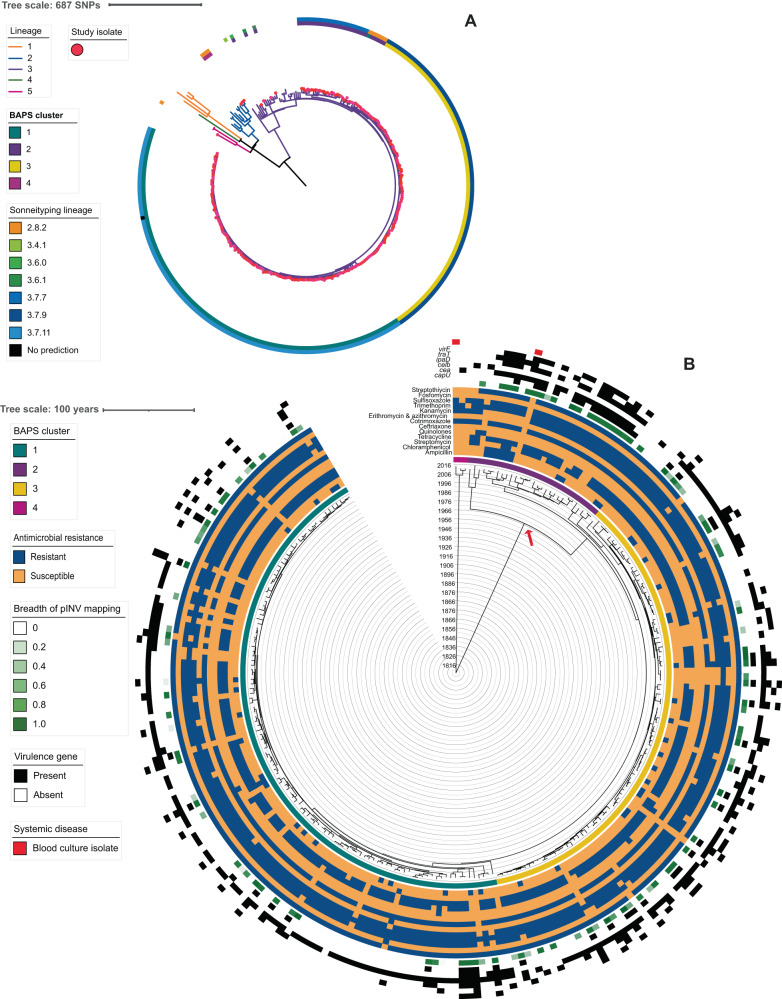
Fig. 4. The contextualised population structure, antimicrobial resistance, and genetic features of South African Shigella sonnei.
The maximum likelihood phylogeny A shows the S. sonnei sub-sampled isolates (indicated by pink dot overlying the terminal node) among some global representatives. The previously defined Lineages are indicated by branch colour while the outer ring shows the predicted genotype for the study isolates, predicted by SonneiTyping software, coloured according to inlaid key. B A Maximum Clade Credibility tree from Bayesian analysis shows the population structure of the S. sonnei with branch lengths in time, scaled in years by the concentric rings radiating from the tree MRCA in the centre. BAPS clusters are indicated in the ring immediately adjacent to tree tips, coloured according to the top inlaid key. Other metadata rings (from inner to outer, coloured according to the inlaid keys) show: antimicrobial resistance profiles by antimicrobial class (combination of predicted and phenotypic—see methods; blue = resistant and orange = susceptible), breadth of mapping coverage across the pINV (green), presence of virulence genes capU, cea, celb, ipaD, traT, virF (black), and derived from a blood sample (rather than stool; red). MRCA for endemic clusters indicated by red arrow. BAPS Bayesian analysis of population structure, pINV large virulence plasmid. MRCA most recent common ancestor, HPDs highest posterior density interval, BAPS Bayesian analysis of population structure. Source data are provided as a Source Data file.

