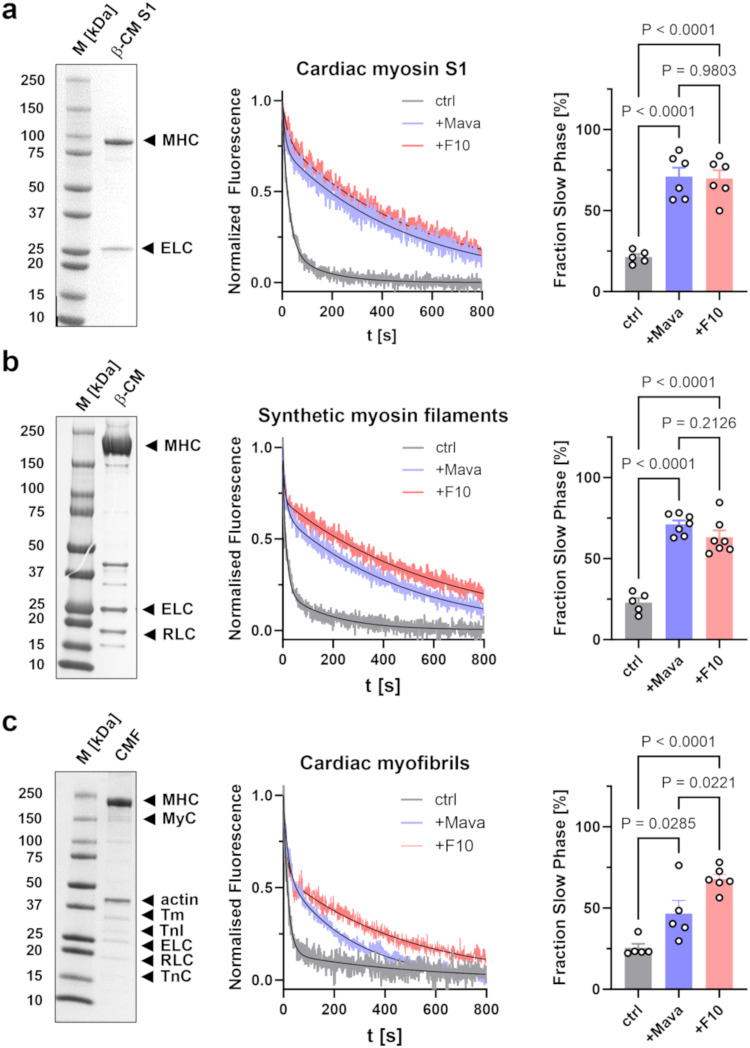
Fig. 3. F10 slows nucleotide release from bovine β-cardiac myosin.
a Left: SDS-PAGE of isolated bovine cardiac myosin S1 with essential light chain (ELC) and myosin heavy chain (MHC) labeled accordingly. Middle: Representative traces of mant-ATP chase experiments in the presence of vehicle control (gray), 2 μmol L-1 Mavacamten (purple) or 20 μmol L-1 F10 (red). Bi-exponential fits to data are shown as black continuous lines. Right: Fraction of slow phase nucleotide release for the three conditions. Means ± s.e.m., n = 5 independent repeats for control, and n = 6 independent repeats in the presence of F10 or Mavacamten. b Left: SDS-PAGE of isolated bovine cardiac myosin with regulatory light chain (RLC), essential light chain (ELC) and myosin heavy chain (MHC) labeled accordingly. Middle: Representative traces of mant-ATP chase experiments in the presence of vehicle control (gray), Mavacamten (purple) and F10 (red). Bi-exponential fits to data are shown as black continuous lines. Right: Fraction of slow phase nucleotide release. Means ± s.e.m., n = 5 independent repeats for control, and n = 7 independent repeats in the presence of F10 or Mavacamten. c Left: SDS-PAGE of isolated bovine cardiac myofibrils with main proteins labeled accordingly (MHC – myosin heavy chain, MyC – myosin binding protein-C, Tm – tropomyosin, TnI – troponin I, ELC – essential light chain, RLC – regulatory light chain, TnC – troponin C). Middle: Representative traces of mant-ATP chase experiments in the presence of vehicle control (gray), 2 μmol L−1 Mavacamten (purple) or 20 μmol L−1 F10 (red). Bi-exponential fits to data are shown as black continuous lines. Right: Fraction of slow phase nucleotide release for the three conditions. Means ± s.e.m., n = 5 independent repeats for control, n = 6 independent repeats in the presence of F10 and n = 6 independent repeats in the presence of Mavacamten. Statistical significance of differences between groups were assessed with a one-way ANOVA followed by Tukey’s post-hoc test. Source data are provided as a Source Data file.

