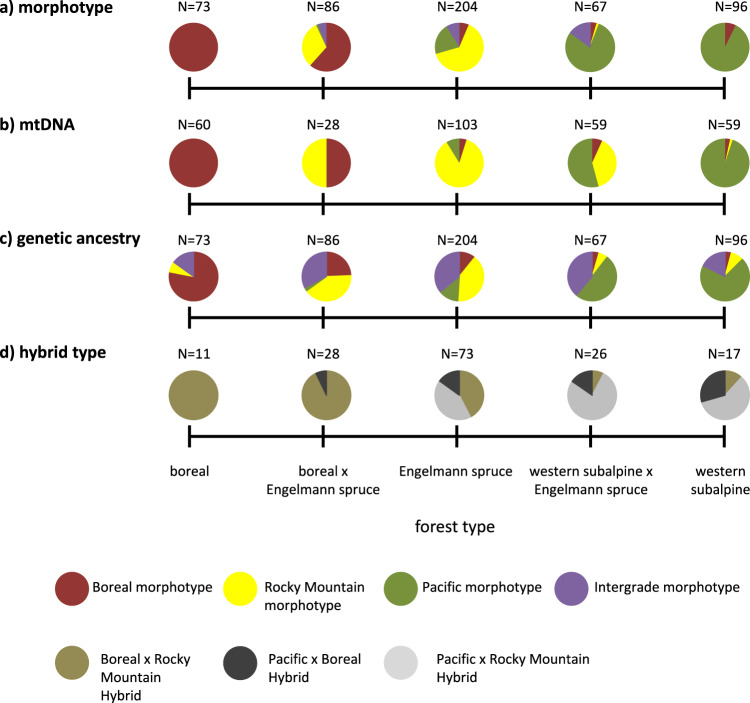
Fig. 4. Summary figure showing the distribution of Canada jay (Perisoreus canadensis) phenotypes and genotypes across forest types.
a Phenotypic patterns based on morphotype assignment by observers; b MtDNA clade; c Genotype assignment of microsatellite data based on hybrid index scores; d Distribution of putative hybrids across forest type (olive = Boreal × Rocky Mountain, dark gray = Pacific × Boreal, light gray = Pacific × Rocky Mountain). Colors in a-c represent Boreal (red), Rocky Mountain (yellow), Pacific (green), and intergrades (purple).

