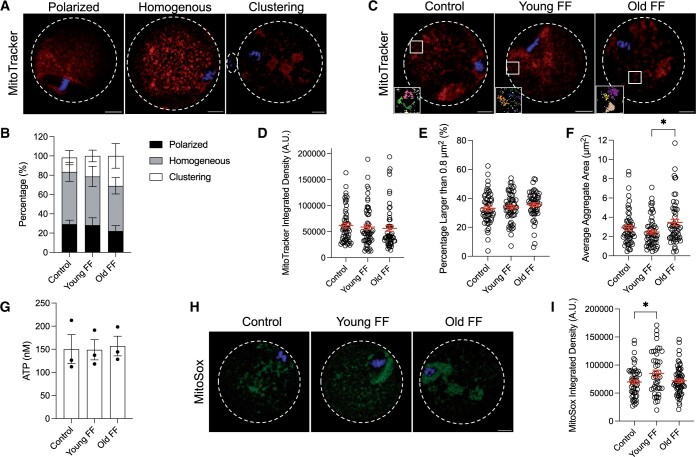
Figure 6.
Follicular fluid (FF) increases size of mitochondrial aggregates in an age-dependent manner. (A) Representative middle z-slices of different mitochondrial distributions in metaphase II mouse eggs. Mitochondria (MitoTracker, red) and DNA (Hoechst, blue) were visualized by live cell dyes. Dashed lines outline the perimeter of eggs and polar bodies if visible in z-slice. Scale bars = 10 µm for all panels. (B) Quantification of mitochondrial distribution for eggs following maturation without FF (control), in young FF, or in old FF. Data are shown as mean±SEM for all panels. N = 54–58 eggs per group across total of three trials. (C) Representative middle z-slice of eggs following maturation without FF (control), in young FF, or in old FF. Mitochondria and DNA visualized as in (A). Boxed regions are magnified in insets. Insets show representative mitochondrial aggregates following thresholding as quantified in (F). Each color corresponds to one aggregate and particles below the minimum size for quantification are displayed in white. Scale bar (gray)=1 µm. (D–F) Quantification of mitochondrial integrated density in arbitrary units (A.U.; D), percentage of mitochondrial aggregates larger than 0.8 µm2 (E), and average mitochondrial aggregate area (F). *P-value ≤0.05 by one-way ANOVA with multiple comparisons. N = 54–58 eggs per group across total of three trials. (G) Quantification of ATP concentration in eggs following maturation without FF (control), in young FF, or in old FF. Each data point represents the average of two wells (each containing 20 eggs) from one experiment. N = 120 eggs per group across total of three trials. (H) Representative middle z-slice of eggs following maturation without FF (control), in young FF, or in old FF. Mitochondrial superoxide (MitoSox, green) and DNA (Hoechst, blue) were visualized by live cell dyes. (I) Quantification of mitochondrial superoxide integrated density in arbitrary units (A.U.). *P-value ≤0.05 by one-way ANOVA with multiple comparisons. N = 44–64 eggs per group across total of four trials.

