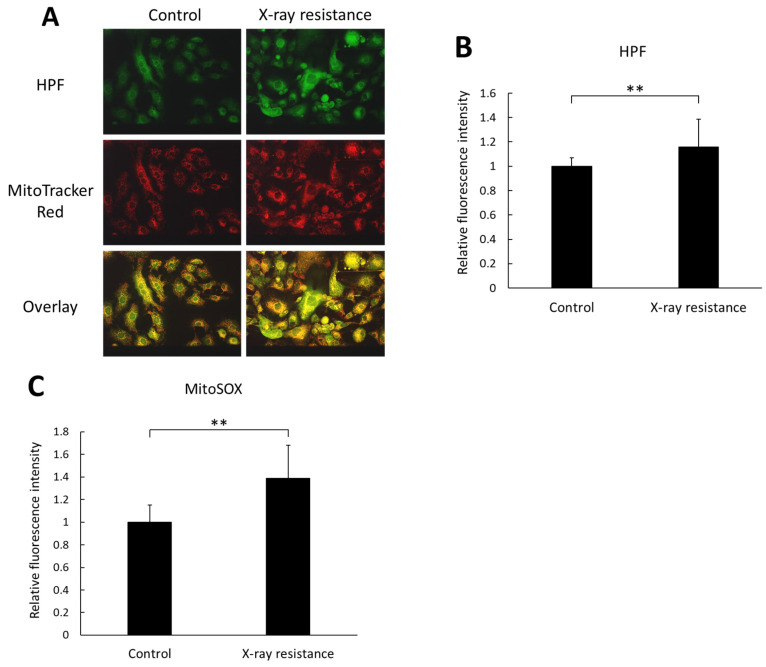
Figure 2.
Intracellular ROS production level was estimated and compared between the X-ray resistant cells and the control cells. (A) representative images of cells stained with HPF and MitoTrackerTM Red CMXRos fluorescence dye. Scale bar: 50 μm. (B) the relative fluorescence intensity of HPF. (C) the relative fluorescence intensity of MitoSOXTM Mitochondrial Superoxide Indicators. Statistical significance was tested by Student’s t-test. n = 120 for control samples in HPF experiment, n = 147 for X-ray resistant samples in HPF experiment, and n = 12 for MitoSOXTM experiment. Mean ± S.D., ** p < 0.01.

