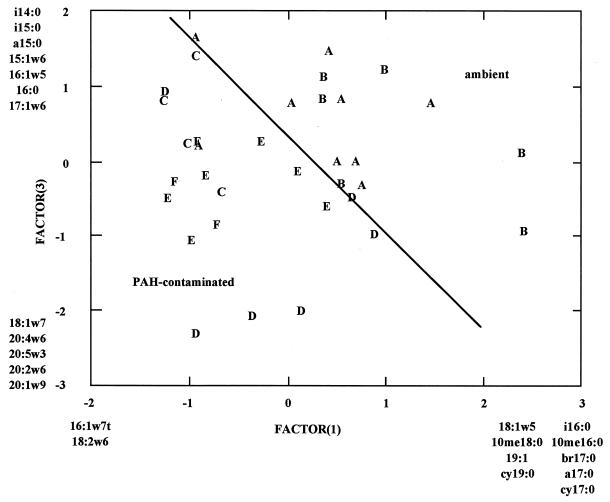
FIG. 2.
Principal component analysis of the Little Scioto River sediment PLFA profiles, factor 1 by factor 3. Letters indicate individual samples and represent sampling stations (A to F). Fatty acids listed at the extremes of the principal components are disproportionately abundant in samples that map to those extremes.

