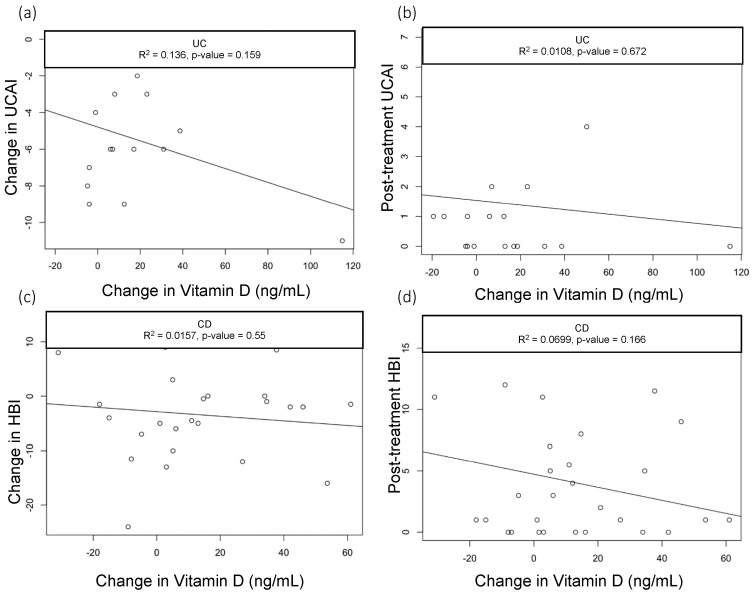
Figure 2.
Correlation of UCAI scores with change in Vitamin D levels. Scatter plots with linear trend lines for UC: (a) change in UCAI and change in vitamin D levels and (b) follow-up UCAI score and change in vitamin D levels. Scatter plots with linear trend lines for CD: (c) change in HBI and change in vitamin D levels (d) and follow-up HBI score and change in vitamin D levels.

