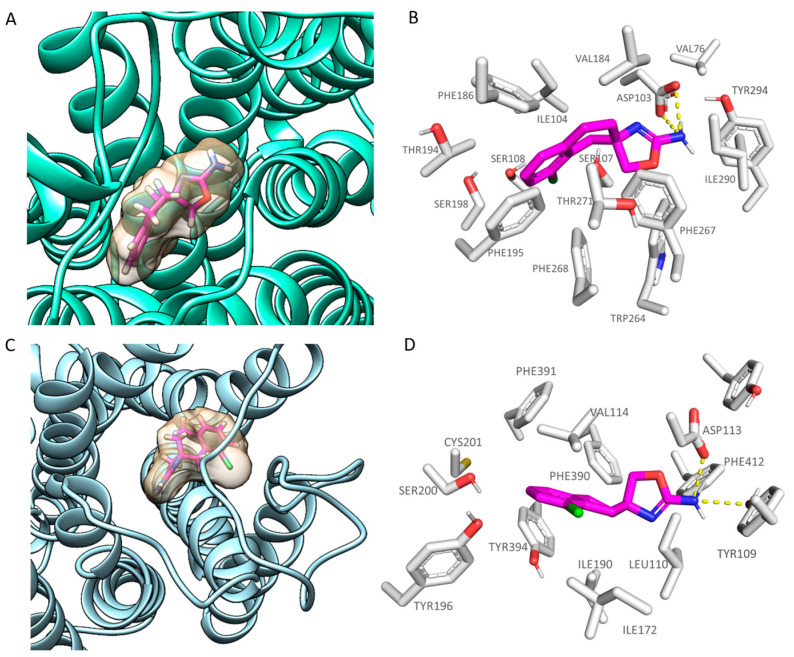
Figure 3.
Docking mode of S18616 (C atom; magenta) at the hTAAR1 (A,B) and α2-ADR (C,D) binding site. A perspective of the ligand volume (light brown) and of the protein cavity is depicted in (A) and (C), respectively. The most important residues involved in the agonist binding are labelled (B,D). A and C representations have been performed via Chimera 1.16 [51], while the ligand-protein contacts have been explored by means of PyMol software 2.5.2—Incentive Product Copyright (C) Schrodinger, LLC [52].

