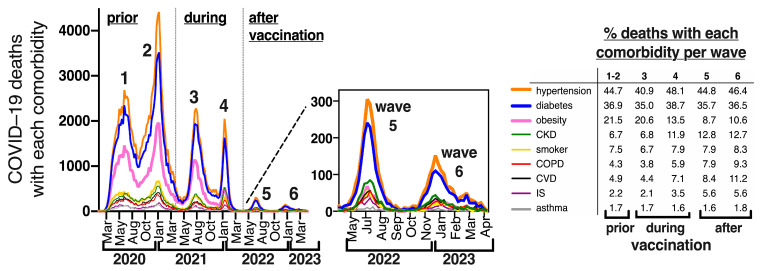
Figure 4.
Comorbidities in COVID-19 deaths in Mexico (all ages) represented as epidemic curves through time during the sanitary emergency. Each color represents a comorbidity of the 9 interrogated in the dataset, irrespective of whether it is presented alone or in combination with other conditions. The insert zooms into waves 5 and 6. The table shows the specific percentage of each comorbidity (alone or in combination with others) per wave; 100% was the total number of COVID-19 deaths in each wave. CKD = chronic kidney disease, COPD = chronic obstructive pulmonary disease, CVD = cardiovascular disease, IS = immunesuppression. The numbers to calculate the percentages shown in this insert table can be found in Table S4.

