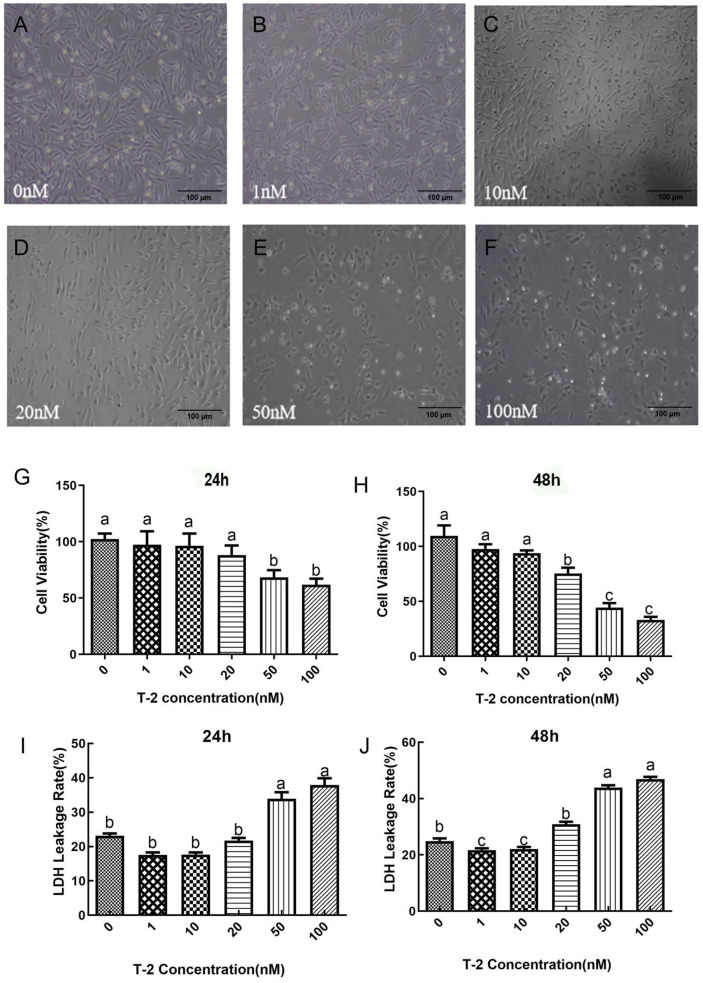
Figure 2.
Microscopic observation in chicken embryo fibroblast cell line (DF-1) cells in response to varying concentrations of T-2 toxin (T2) treatment (100×). Micrograph of control cells (A); micrograph of 1 nM T2-treated cells (B); micrograph of 10 nM T2-treated cells (C); micrograph of 20 nM T2-treated cells (D); micrograph of 50 nM T2-treated cells (E); micrograph of 100 nM T2-treated cells (F). The cell viability (%) of DF-1 cell treated with the different concentrations of T2 for 24 h (G) or 48 h (H). The lacate dehydrogenase (LDH) leakage rate (%) of DF-1 cell with the different concentrations of T2 for 24 h (I) and 48 h (J). Note: Values with the difference superscript letters (a–c) are significant differences (p < 0.05).

