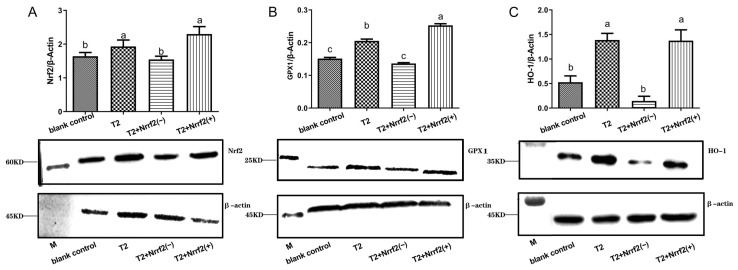
Figure 9.
Relative expression data and protein immunoblot analysis of oxidative stress-related factors Nrf2 (A), GPX1 (B) and HO-1 (C) proteins in T2-treated or untreated normal DF-1 cells, Nrf2 knockdown DF-1 cells and overexpressed DF-1 cells for 24 h. Note: Values with the difference superscript letters (a–c) are significant differences (p < 0.05).

