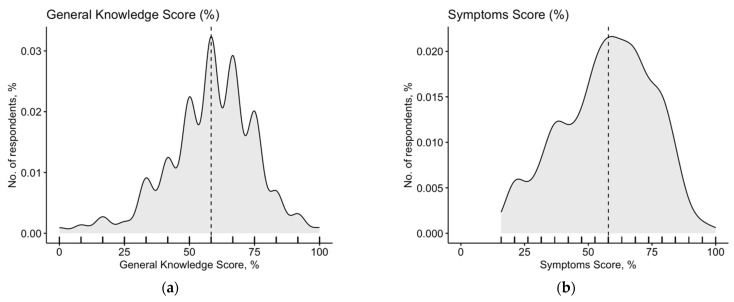
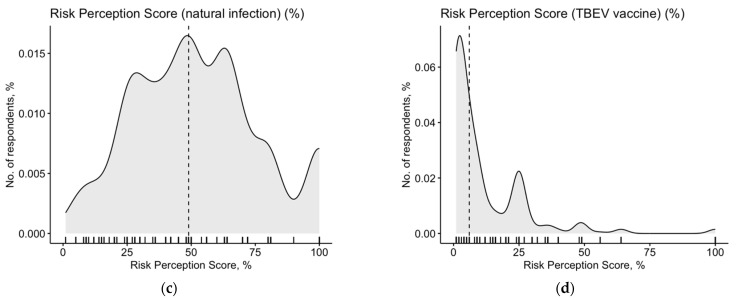
Figure A2.
Distribution of the general knowledge score (GKS; a), a summary score for symptoms associated with tick-borne diseases (symptoms score; b), a risk perception score (RPS) for tick-borne diseases (c), and the RPS for side effects of the TBE vaccine (d). For all sum scores, distribution did not pass a normality check according to the D’Agostino–Pearson test (GKS: K2 = 63.71, p < 0.001; symptom score: K2 = 37.55, p < 0.001; RPS for natural infection: K2 = 30.11, p < 0.001; RPS for the TBE vaccine: K2 = 569.1, p < 0.001).


