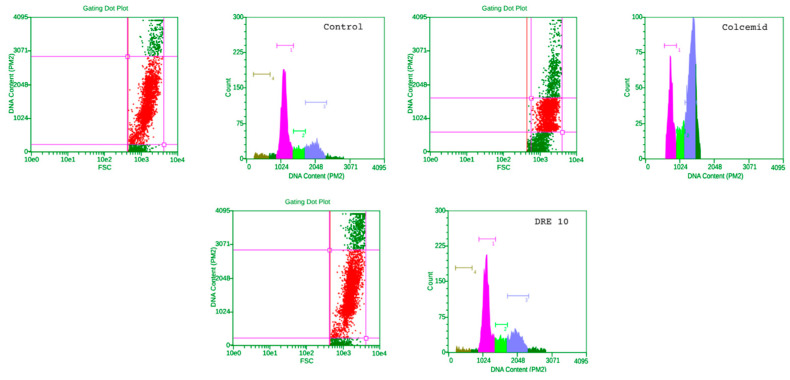
Figure 7.
Flow cytometry of HepG2 cells treated with a low dose (10 µg/mL) of DRE. Dot plots and histograms of representative experiments are shown. Cell populations included in the analysis are represented by red dots. In the histograms, pink represents the count of cells in G0/G1 phase, green the count of cells in S phase and purple the count of cell in G2/M phase of the cell cycle.

