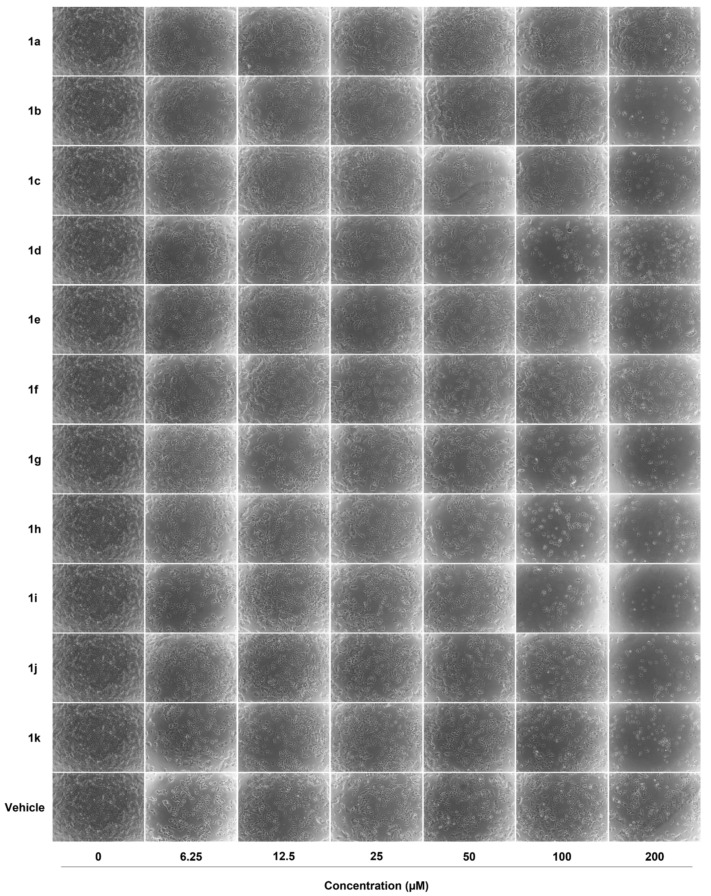
Figure 4.
Effect of chemical compounds 1a–1k on cell viability of MCF-7 cells. Representative bright-field microscopy images of MCF-7 tumor cells. Cells were treated with different concentrations of the chemical molecules (0, 6.25, 12.5, 25, 25, 50, 100, and 200 µM) or vehicle (DMSO) for 48 h. Images of the morphological changes at 48 h were taken with a 10× objective on an inverted microscope.

