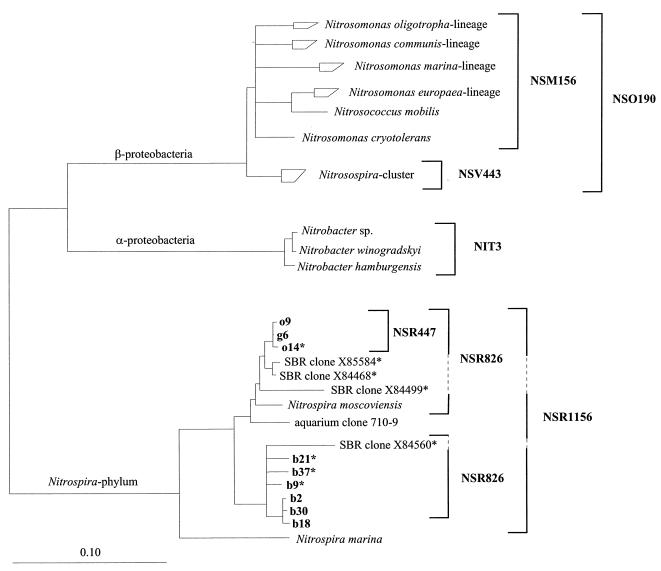
FIG. 2.
Phylogenetic tree inferred from comparative analysis of 16S rRNA sequences. The tree is based on the results of maximum-likelihood analysis of sequences of >1,400 nucleotides. Partial sequences (marked by an asterisk) were added by maximum-parsimony analysis without changing the tree topology. Target organisms of probes used in this study are indicated by brackets; SBR clones are not sequenced in the probe target regions. The bar represents 0.1 estimated change per nucleotide.

