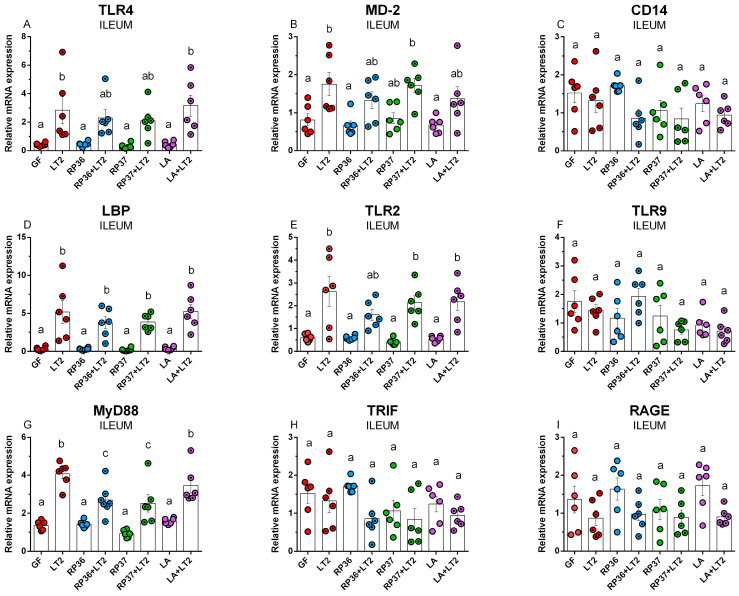
Figure 3.
Expression of TLR4 (A), MD-2 (B), CD14 (C), LBP (D), TLR2 (E), TLR9 (F), MyD88 (G), TRIF (H), and RAGE (I) in the ileum of the GN minipigs: (i) GF, (ii) infected with LT2 (LT2), (iii) associated with RP36 (RP36), (iv) associated with RP36 and challenged with LT2 (RP36+LT2), (v) associated with RP37 (RP37), (vi) associated with RP37 and challenged with LT2 (RP37+LT2), (vii) associated with LA (LA), and (viii) associated with LA and challenged with LT2 (LA+LT2). The values are presented as individual dots indicating mean ± SEM. Statistical differences were evaluated using one-way ANOVA with Tukey’s post-hoc test, and p < 0.05 is denoted with different letters above the columns. Six samples in each group were analyzed.

