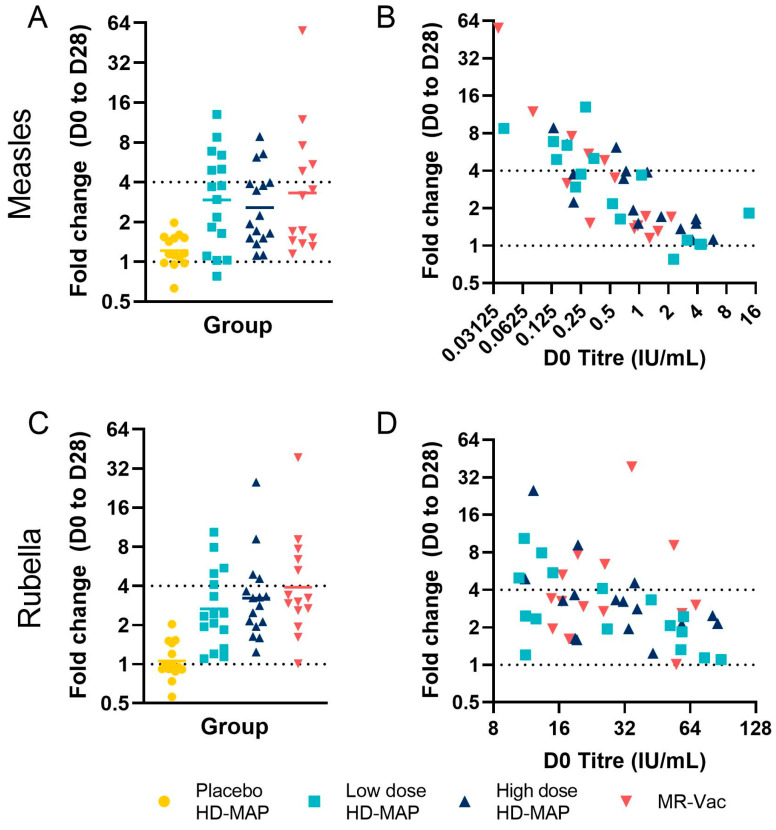
Figure 6.
FRNT50 D0 to D28 fold change. (A) Measles and (C) rubella FRNT50 fold change between D0 and D28 for all groups; bar represents geometric mean. The relationship between D0 titre (x axis) and D28 fold change (y axis) is shown for (B) measles and (D) rubella. In both graphs, each point represents a single subject, coloured by group. Dotted lines represent seroconversion (fold change ≥ 4) or no change (fold change = 1).

