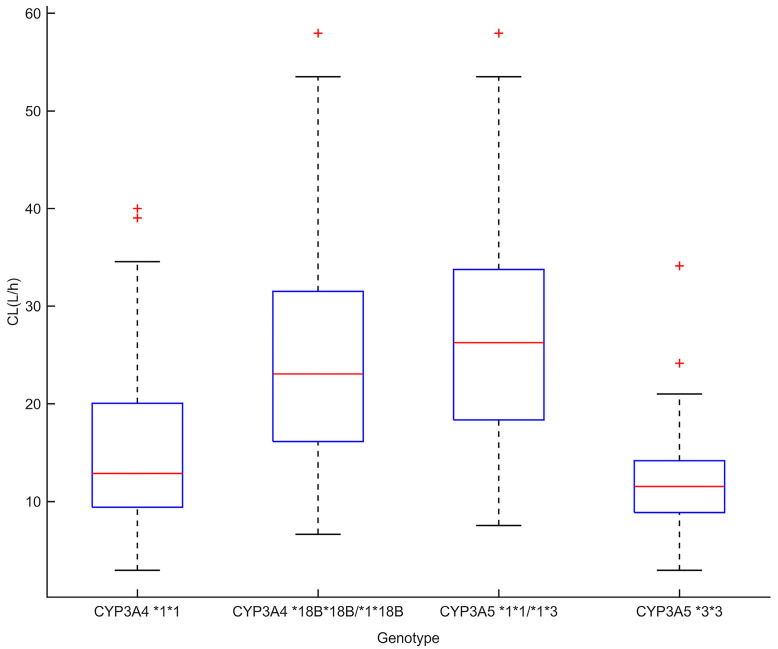
Figure 1.
Tacrolimus clearance of CYP3A5*3 and CYP3A4*18B genotypes in heart transplant patients (p < 0.05). The box represents the Bayesian estimate of tacrolimus clearance in the population model. The edges of the box represent the 25th and 75th percentiles; the red lines inside the box represent the median; the dotted lines represent the 2.5th and 97.5th percentiles; the plus signs show outliers.

