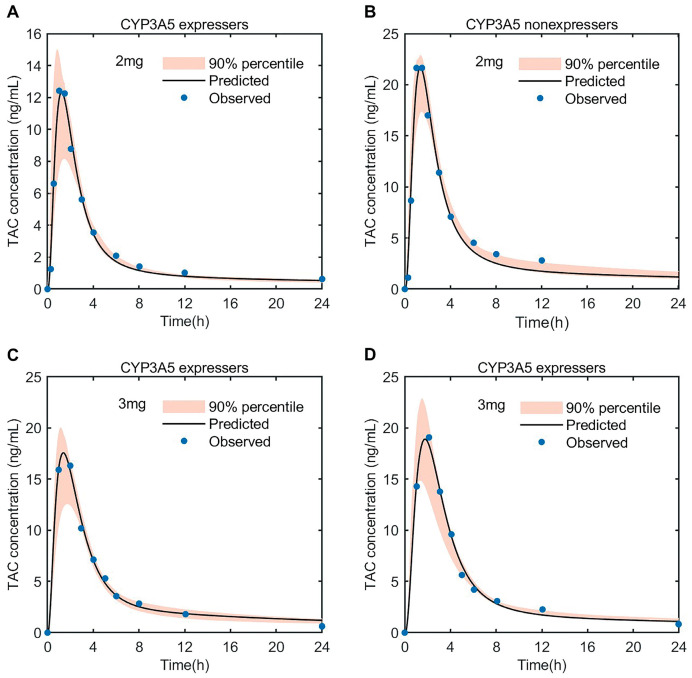
Figure 4.
Predicted blood concentration–time profiles of tacrolimus after oral dose of 2 mg (A,B) and 3 mg (C,D) in healthy CYP3A5 expressers and non-expressers. The thick line represents the mean predicted concentration; the orange shadow represents the 5th and 95th percentiles of the prediction; the solid dots represent the mean observed data. TAC, tacrolimus.

