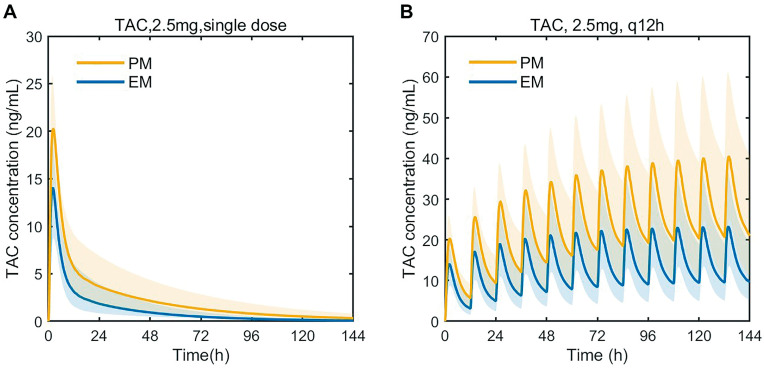
Figure 7.
Predicted blood concentration–time profiles of tacrolimus after a single oral dose of 2.5 mg tacrolimus (A), predicted blood concentration–time profiles of tacrolimus after multidose of tacrolimus (2.5 mg, q12h for 6 days) (B). TAC, tacrolimus; EM: extensive metabolizers (CYP3A5*1*1 or *1*3 and CYP3A4*18B*18B or CYP3A4*1*18B); PM: poor metabolizers (CYP3A5*3*3 and CYP3A4*1*1). The thick line represents the mean predicted data; the yellow and blue shadow represents the 5th and 95th percentiles of the prediction.

