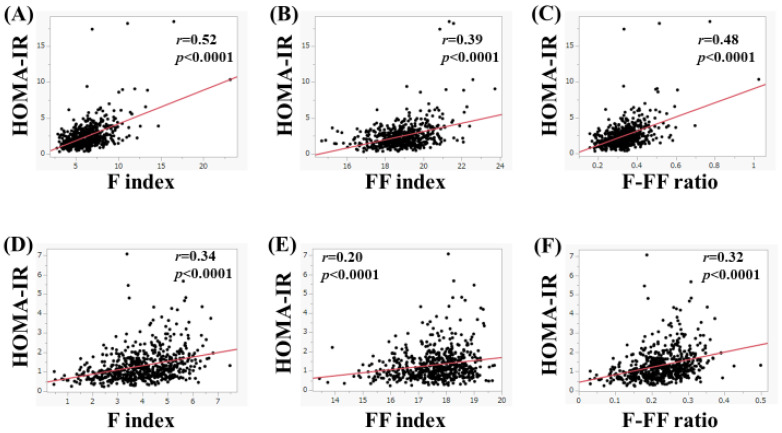
Figure 6.
(A–C) The correlation between HOMA-IR and body composition parameters in men with fatty liver upon ultrasonography (n = 582). (A) F index, (B) FF index, and (C) F-FF ratio. (D–F) The correlation between HOMA-IR and body composition parameters in men without fatty liver on ultrasonography (n = 604). (D) F index, (E) FF index, and (F) F-FF ratio.

