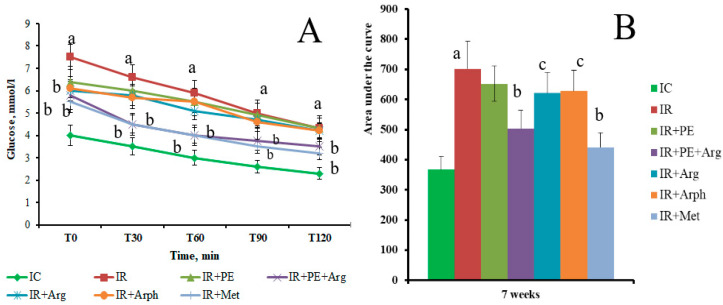
Figure 5.
The insulin sensitivity of rats in the experimental groups at the 7th week from a zero point and after 2 weeks of treatment. (A)—ITT; (B)—AUC values calculated for ITT (mmol/Lx120 min). a—indicates a significant difference relative to the IC group (p ≤ 0.05). b—indicates a significant difference relative to the IR group (p ≤ 0.05). c—indicates a significant difference relative to the IR + PE + Arg group (p ≤ 0.05).

