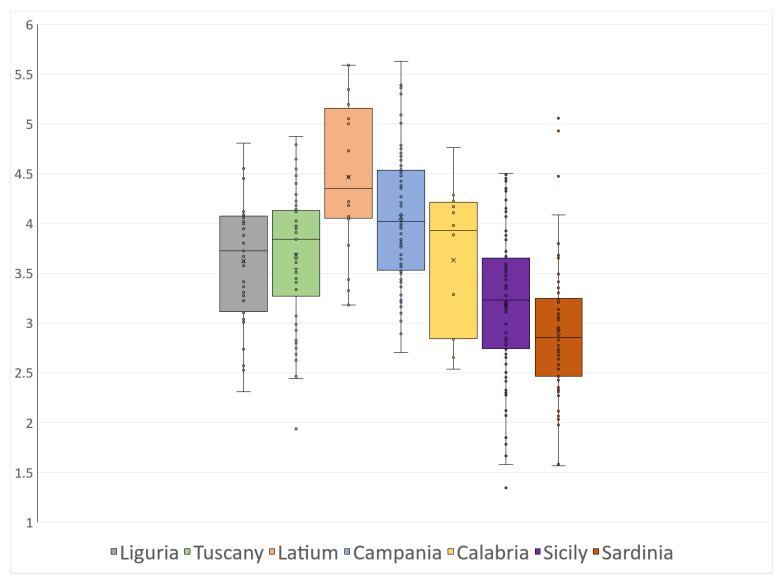
Figure 3.
In situ TRIX distribution across the study area. Data are grouped according to the seven administrative regions, which are referred to using the same colors as in Figure 1. The box plot shows the median value of each region and the respective first and third quartiles, minimum and maximum; the black dots are the data points.

