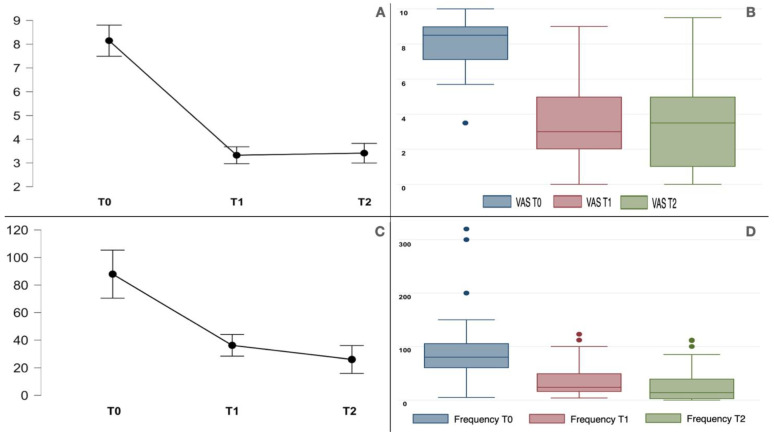
Figure 1.
(A,B) The plot line (with standard error bars) and the boxplot for VAS of all the TN patients studied at the baseline (T0) and at 1-month (T1) and 3-month (T2) evaluations. There was a significant improvement in pain intensity throughout the follow-ups (F1.2,48.8 = 128.2, p < 0.001). (C,D) The plot line (with standard error bars) and the boxplot for paroxysm frequency (number per week) of all the TN patients studied at the baseline (T0) and at 1-month (T1) and 3-month (T2) evaluations; this variable improved significantly (F1.0,40.4 = 28.9, p < 0.001). The boxplots are represented by the median, the interquartile range, and the minimum and maximum scores (whiskers); the dots represent the outliers.

