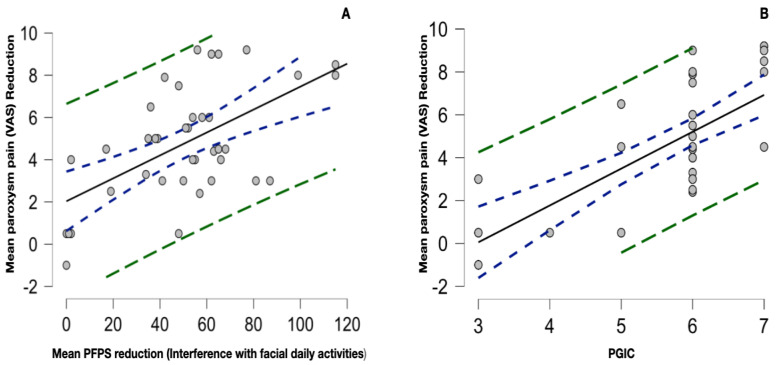
Figure 6.
(A) Scatter plot of the significant correlation between the mean paroxysm pain reduction and the mean PFPS score reduction (interference with daily facial activities only); r 0.6, 0.3–0.8, p < 0.001. (B) Significant correlation between the PGIC and the mean paroxysm pain reduction; r 0.7, 0.5–0.8, p < 0.001. The dotted blue curve represents the 95% confidence interval, while the green dotted curve represents the 95% prediction interval.

