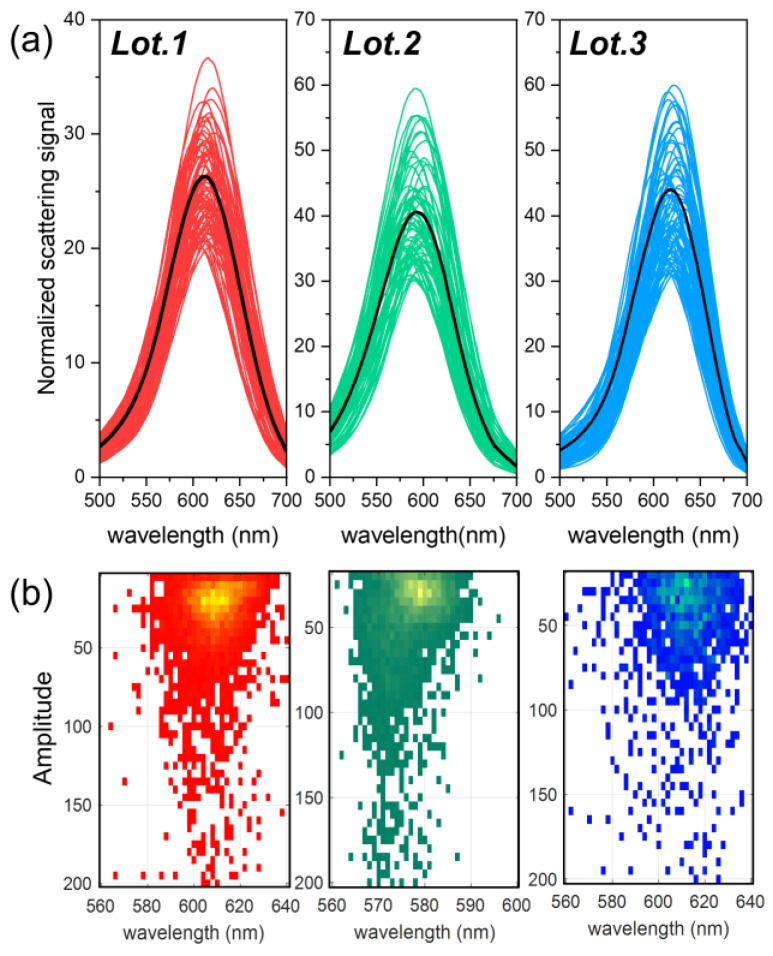
Figure 5.
(a) Scattering spectra obtained with DF-SPS normalized to background signal, collected from more than hundreds of mGNP monomers; the black curve represents the average of the scattering spectra of the entire monomer population from each batch. (b) Heatmap of the scattering amplitude and emission of the plasmonic maximum of ~3000 individual particles from each lot; the lighter the color of the heatmap, the more nanoparticles emit at those spectral values. To calculate both values, each individual emission line has been fitted to a Lorentzian function [55].

