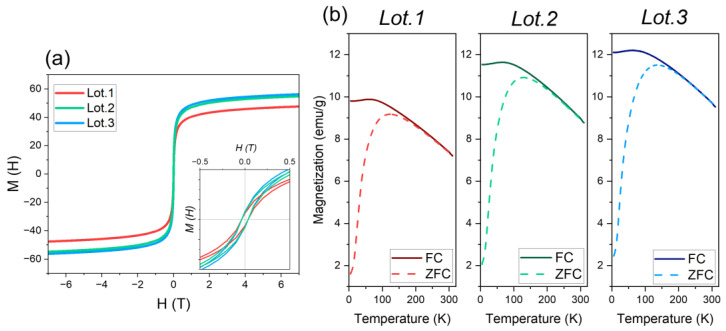
Figure 6.
(a) Hysteresis loop of the 3 different lots of mGNPs recorded at room temperature. At the bottom of the graph, an inset that shows the loops at lower magnetic fields. (b) Variable temperature magnetization curves (ZFC/FC) of each lot of particle collected under 100 Oe field. Solid and dashed lines represent data from field-cooled (FC) and zero-field-cooled (ZFC) measurements, respectively.

