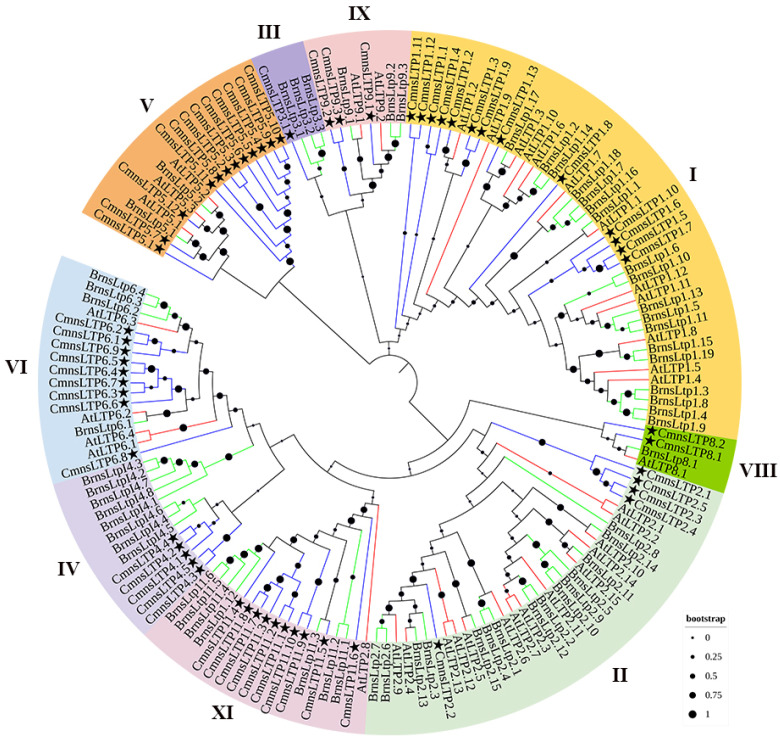
Figure 1.
Phylogenetic tree of nsLTP proteins from C. mollissima, A. thaliana, and B. napus. Nine nsLTP protein types are marked using different colors. Stars represent the genes of C. mollissima. Blue lines represent the genes of C. mollissima. Green lines represent the genes of B. napus. Red lines represent the genes of A. thaliana. Black dots represent the clades’ support values in the phylogenetic trees.

