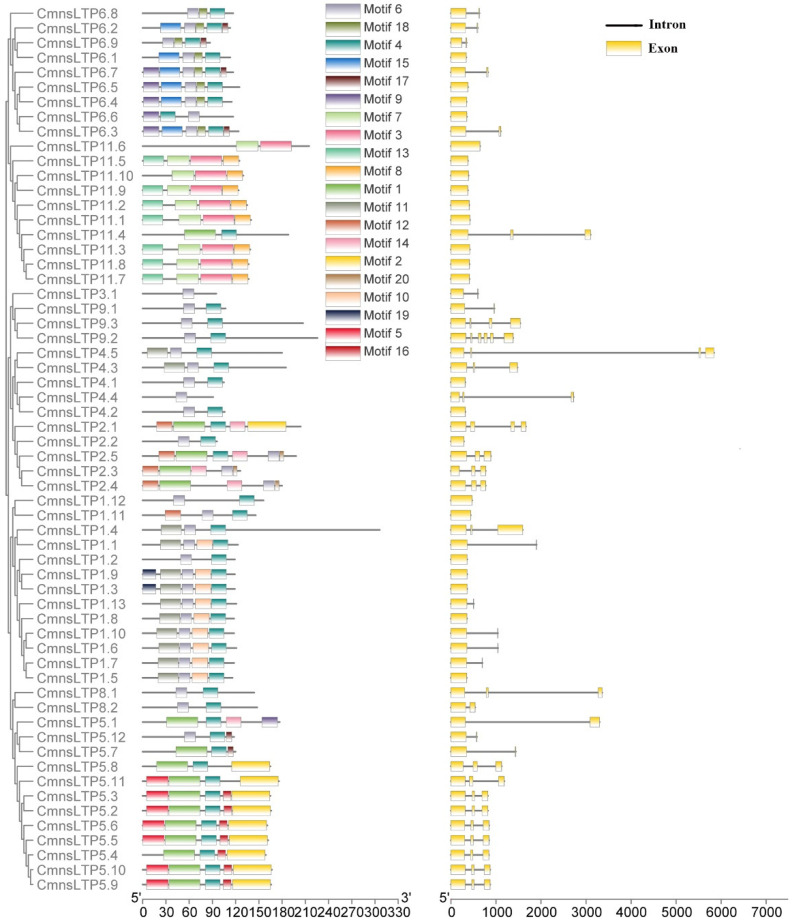
Figure 2.
Gene structure and motif compositions of CmnsLTPs. Left: conserved motif composition of CmnsLTPs. The different colored boxes represent different motifs. The scale bar at the bottom represents 30 aa. Right: intron–exon structure of CmnsLTPs. Yellow boxes represent exons; gray lines represent introns. The scale bar at the bottom represents 1000 bp.

