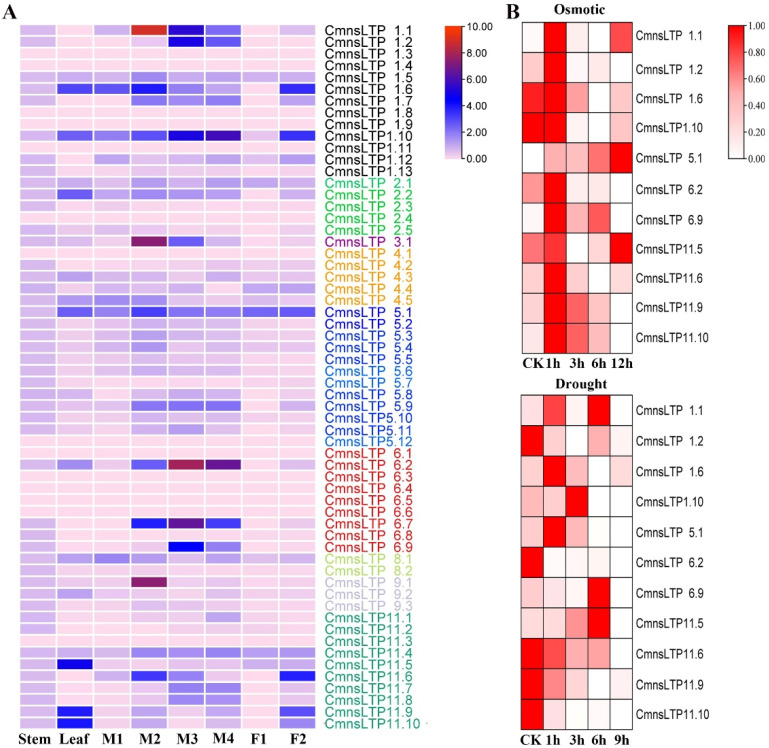
Figure 4.
Expression profiling of CmnsLTPs. (A) Expression analysis of CmnsLTPs in various tissues of chestnut. The visualization of the result was achieved using TBtools. Different colored CmnsLTPs represent different expression patterns. The color scale represents the relative signal intensity. M1, M2, M3, and M4 represent male chestnut flowers at four developmental stages. M1, flower bud primordium differentiation stage; M2, perianth formation stage; M3, pollen mother cell and tetrad stage; M4, pollen grain maturation period. F1 represents the female chestnut flower at the ovule differentiation stage; F2, maturation period. (B) Heat map representation of CmnsLTPs under osmotic (0 h, 1 h, 3 h, 6 h, and 24 h) and drought (0 h, 1 h, 3 h, 6 h, and 9 h) stress from the qRT-PCR experiment. The color bar represents the relative signal intensity value.

