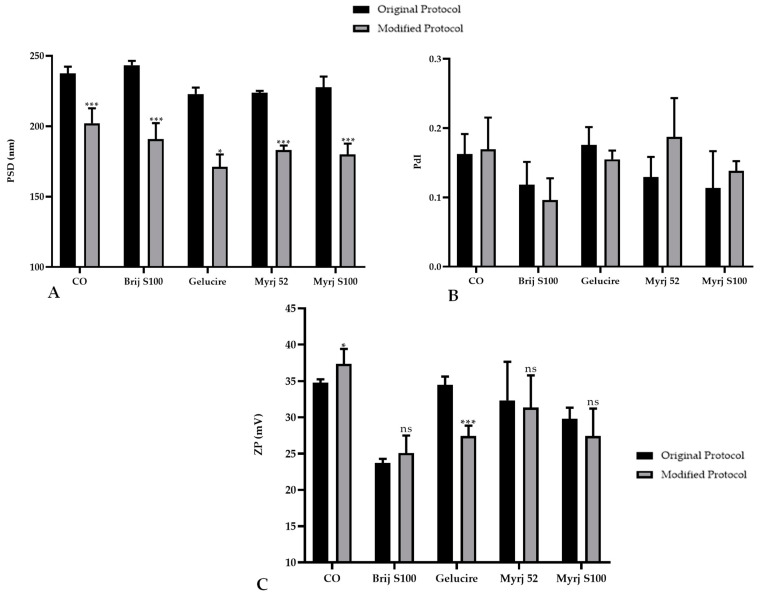
Figure 2.
Comparative analysis of the (A) particle size distribution (PSD), (B) polydispersity index (PdI), and (C) zeta potential (ZP) of PEGylated and non-PEGylated nanoparticles with two different protocols. CO represents cholesteryl oleate, corresponding to the formulation without PEG. Statistical analysis was performed in triplicate. Bars without an asterisk (*) are not significant (ns), * p = 0.01–0.05 and *** p < 0.001.

