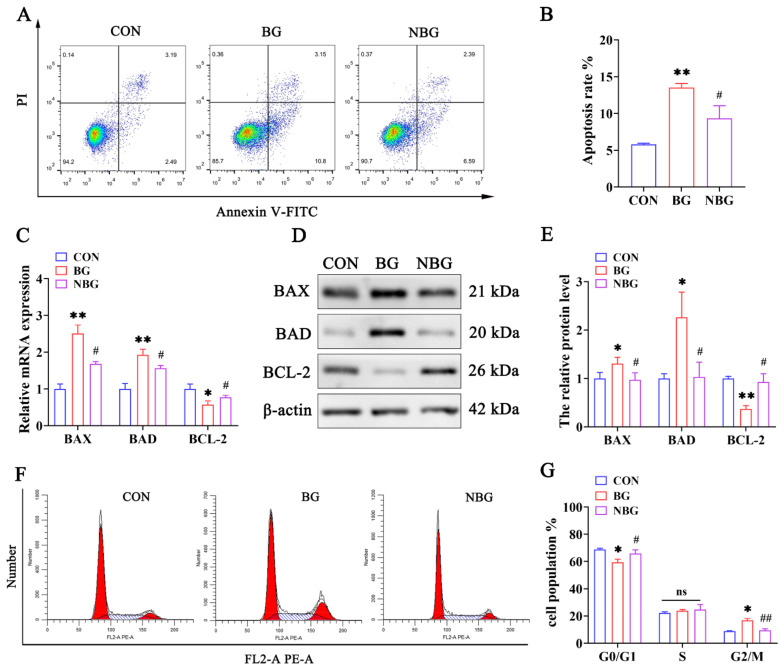
Figure 5.
NAC attenuates BPAF-induced apoptosis and cell cycle arrest in ST cells. (A) Apoptotic rates in ST cells were analyzed via Annexin V-FITC/PI staining and flow cytometry post-treatment in the CON, BG, and NBG groups. (B) Quantitative assessment of apoptosis following the treatments. (C,D) The expression levels of BAX, BAD, and BCL-2 were determined using RT-qPCR (C) and western blot (D) across the treatment groups. (E) Quantitative representation of the western blot results in bar graph format. (F) Cell cycle phase distribution post-treatment, determined through flow cytometry, indicating shifts in cell cycle dynamics. (G) Histogram and statistical analysis illustrating the cell cycle alterations. (H,I) The expression levels of PCNA, CDK2, and CDK4 were determined using RT-qPCR (H) and western blot (I) across the treatment groups. (J) Quantitative representation of the western blot results in a bar graph format. 0 μM BPAF + 0 mM NAC group, CON; 50 μM BPAF + 0 mM NAC group, BG; 50 μM BPAF + 5 mM NAC group, NBG. The data presented here represent the mean ± SD of at least three separate experiments. * p < 0.05 and ** p < 0.01 versus the CON. # p < 0.05 and ## p < 0.01 versus the BG. ns, not significant (p > 0.05).


