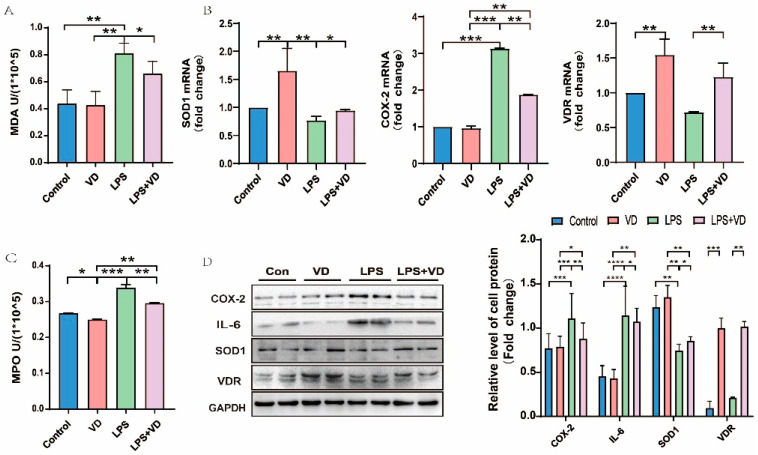
Figure 2.
The inflammation and oxidative stress factors in UC were suppressed by VD/VDR. (A) LPS group showed high level of MPO compared with LPS + VD group. (B) RT-PCR was used to detect the mRNA levels of SOD1, COX-2, and VDR. (C) In comparison with LPS group, MDA content in LPS + VD group was significantly decreased. (D) Western blot showed inflammatory factors and oxidative stress proteins in LPS-induced cell model. Values shown are means ± SD. * p < 0.05, ** p < 0.01, *** p < 0.001 and **** p < 0.0001. (n = 3 in each group).

