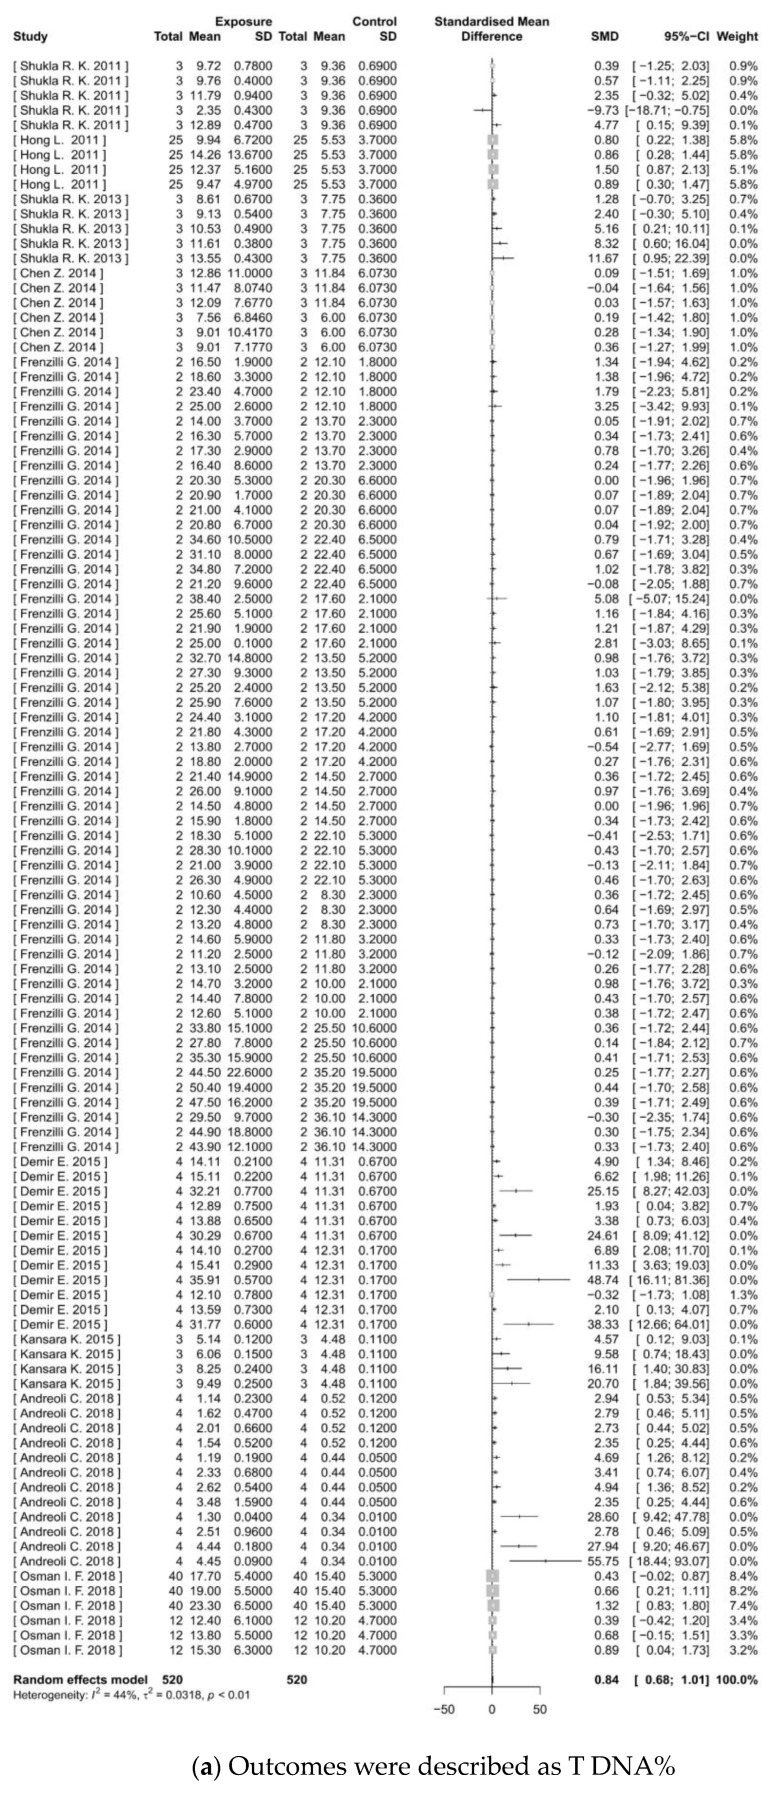
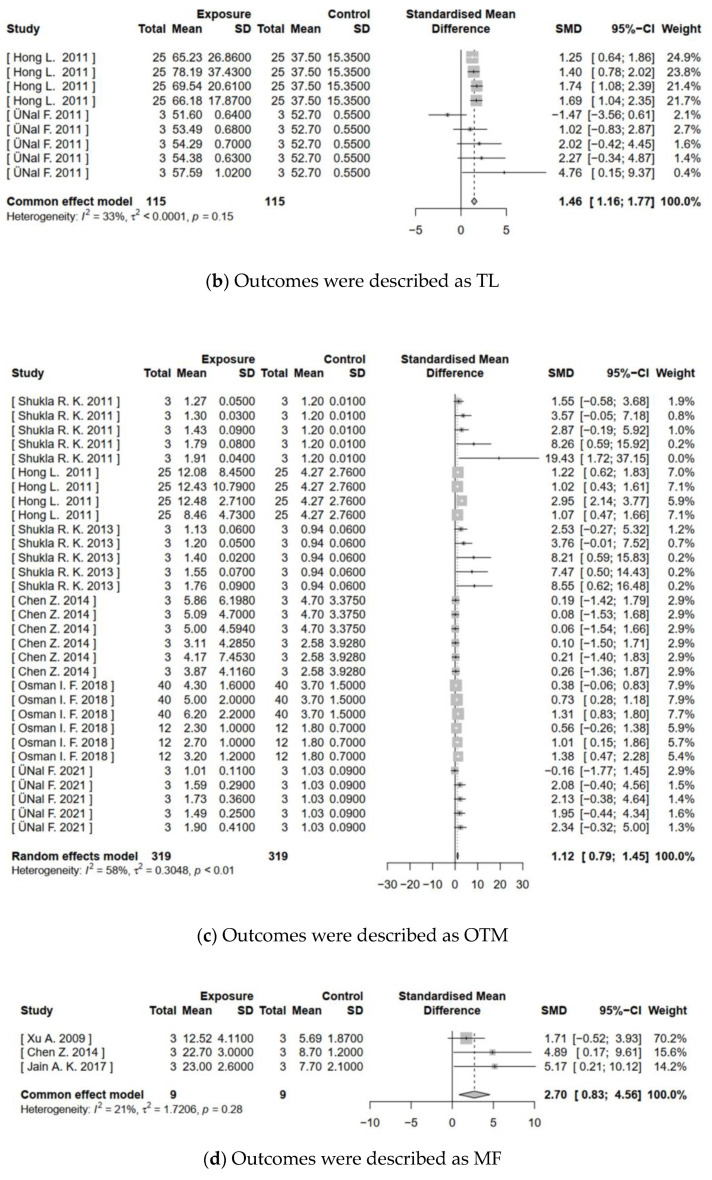
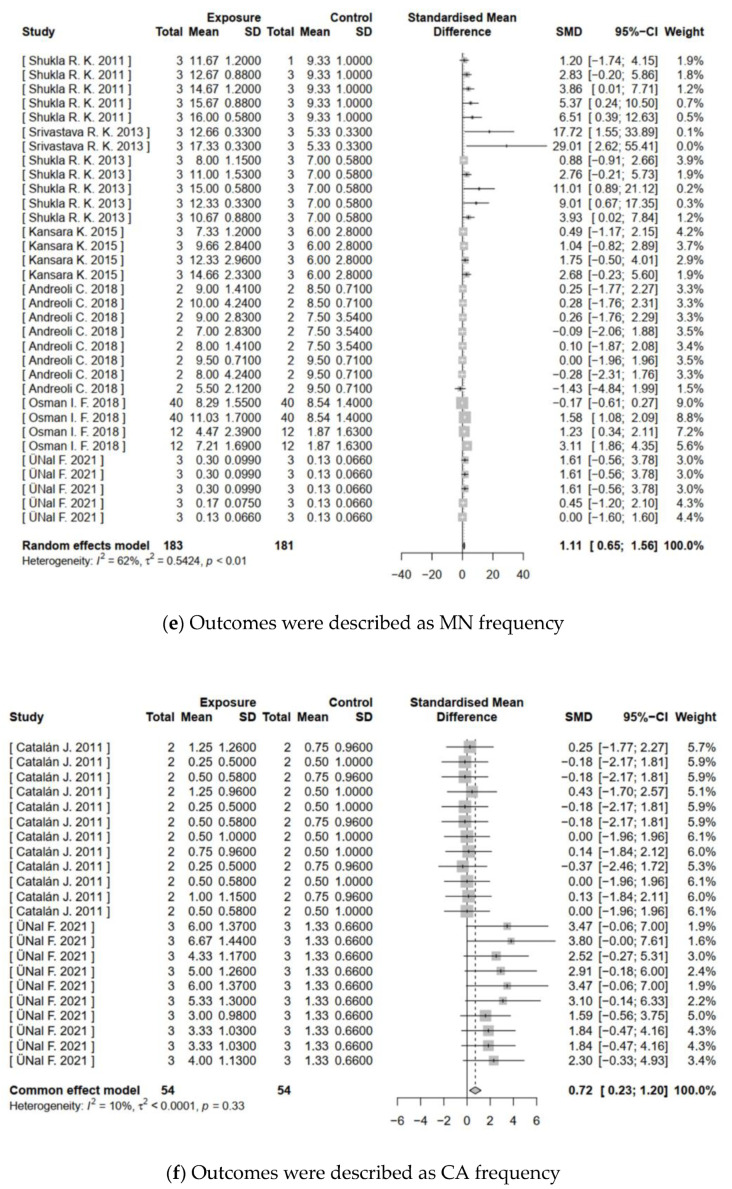
Figure 4.
Meta-analysis for in vitro genotoxicity of TiO2 NPs. (a–f) Show the forest plots for genotoxicity endpoints of T DNA%, TL, OTM, MF, MN frequency, and CA frequency, respectively. ‘SD’ is the standard deviation; ‘SMD’ is the standardized mean difference; ‘95%CI’ is the 95% confidence interval; ‘I2′ is Higgins’s inconsistency statistic; and ‘τ2′ is the estimate of between-study variance. Significance is at p < 0.05.


