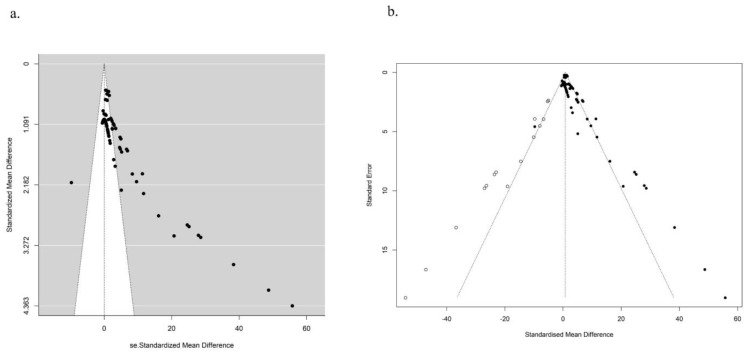
Figure 6.
Egger funnel diagram of in vitro T DNA% before (a) and after (b) publication bias correction by the trim and fill method. The middle line shows the overall estimated standard mean difference. Black dots represent the original studies included, and white dots indicate studies that need supplementation.

