
FIGURE 5:
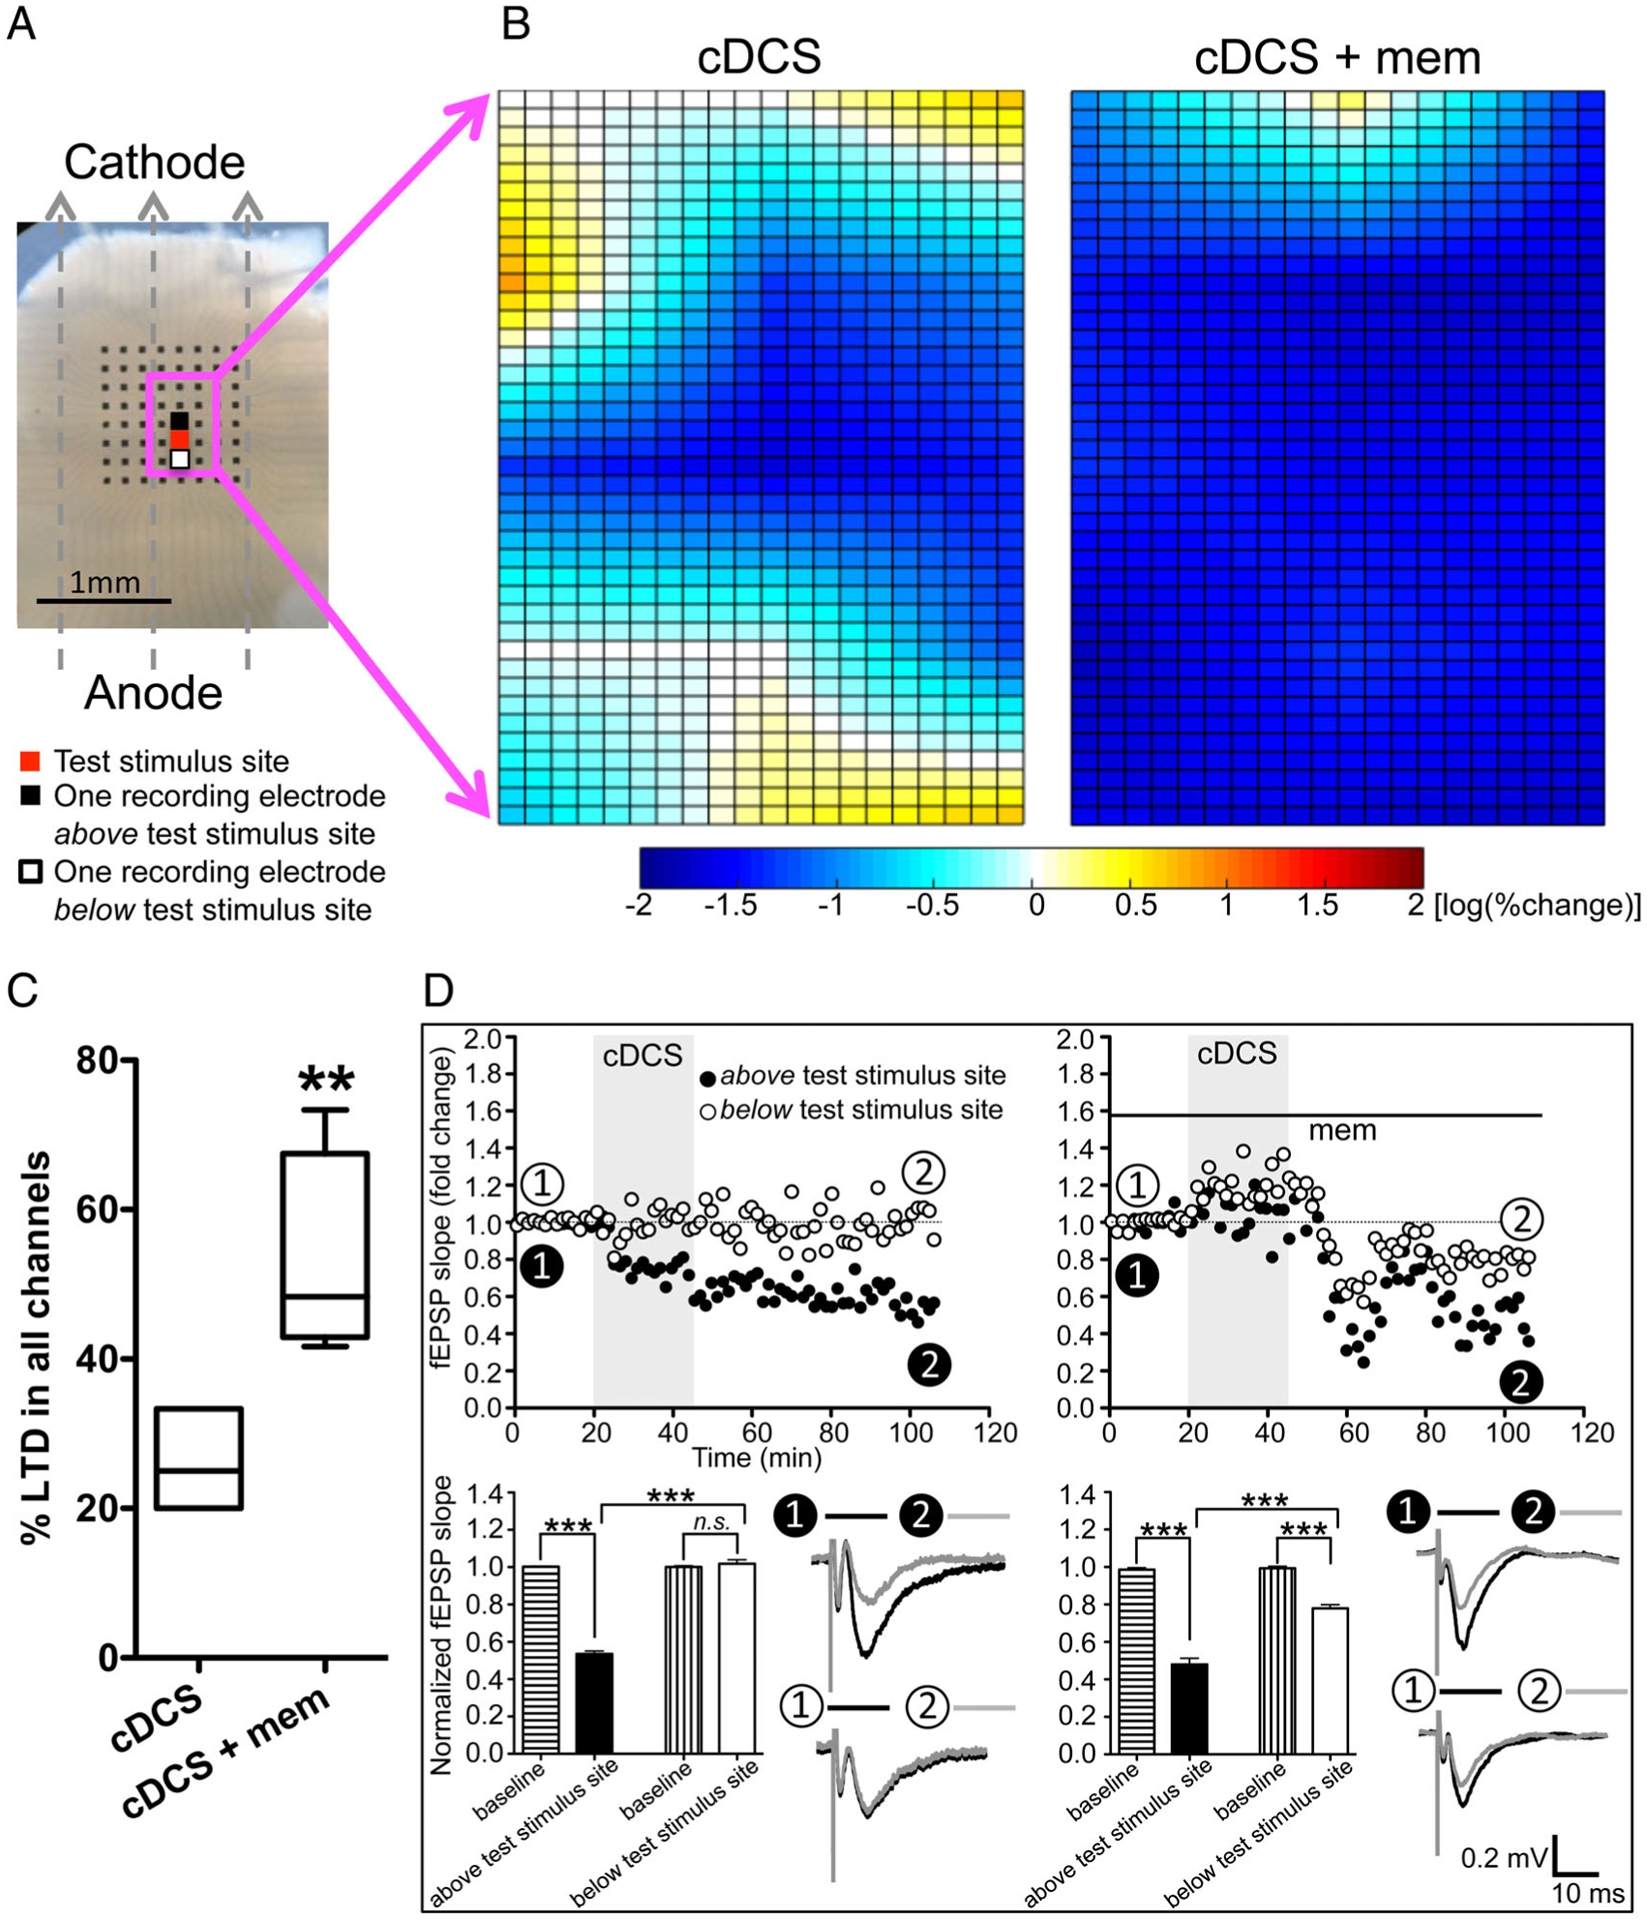
Nonuniform direct current stimulation (DCS) aftereffects were also detected in human cortical slices in vitro, and DCS–long-term depression (LTD) was facilitated by N-methyl-D-aspartate–type glutamate receptor block. (A) Cathodal DCS (cDCS) is applied over a human cortical slice. Dashed arrows indicate the electrical field orientation. The 8 × 8 electrode array is indicated as black dots. The test stimulus site is marked as red, and field excitatory postsynaptic potentials (fEPSPs) were recorded from the channels indicated by the magenta square to create color maps. Two channels selected to draw the time course of fEPSP changes are marked as black (above test stimulus site) and white (below test stimulus site). Scale bar = 1mm. (B) Due to the variable cortical layer orientation and absent control of the slice angle relative to the pial surface, instead of overlapping and computing an average of 5 human cortical slices (fEPSPs were elicited from 3 × 4 channels in 1 slice and from 3 × 5 channels in 4 slices surrounding the test stimulus site), a color map of cDCS aftereffects is obtained from a single human cortical slice (left). This representative map created from 1 human cortical slice shows that cDCS-induced depression was mixed with no change or slight potentiation of cortical excitability. One representative map created from 1 human cortical slice of 4 samples recorded (fEPSPs were elicited from 3 × 4 channels in 2 slices and from 3 × 5 channels in the other 2 slices surrounding the test stimulus site) shows the combined cDCS and memantine (mem; 100μM) effects (right). (C) The cDCS+mem-treated human cortical slices (n = 4) had an increased number of channels with DCS-LTD responses compared to the cDCS-only–treated human cortical slices (n = 5, **p < 0.01 indicates unpaired t test between the 2 treatments). (D) Time course of fEPSP slope changes in 1 cDCS-treated human cortical slice shows that DCS-LTD is only detected in the channel (closed circles) above the test stimulus site, not in the channel (open circles) below the test stimulus site (left column). In the presence of mem (right column), cDCS induces DCS-LTD in both the selected channels (***p < 0.001 and not significant [ns], p > 0.05, 1-way analysis of variance post-test comparing between the last 10 minutes of recording from each channel and their baseline or comparing between the 2 channels).