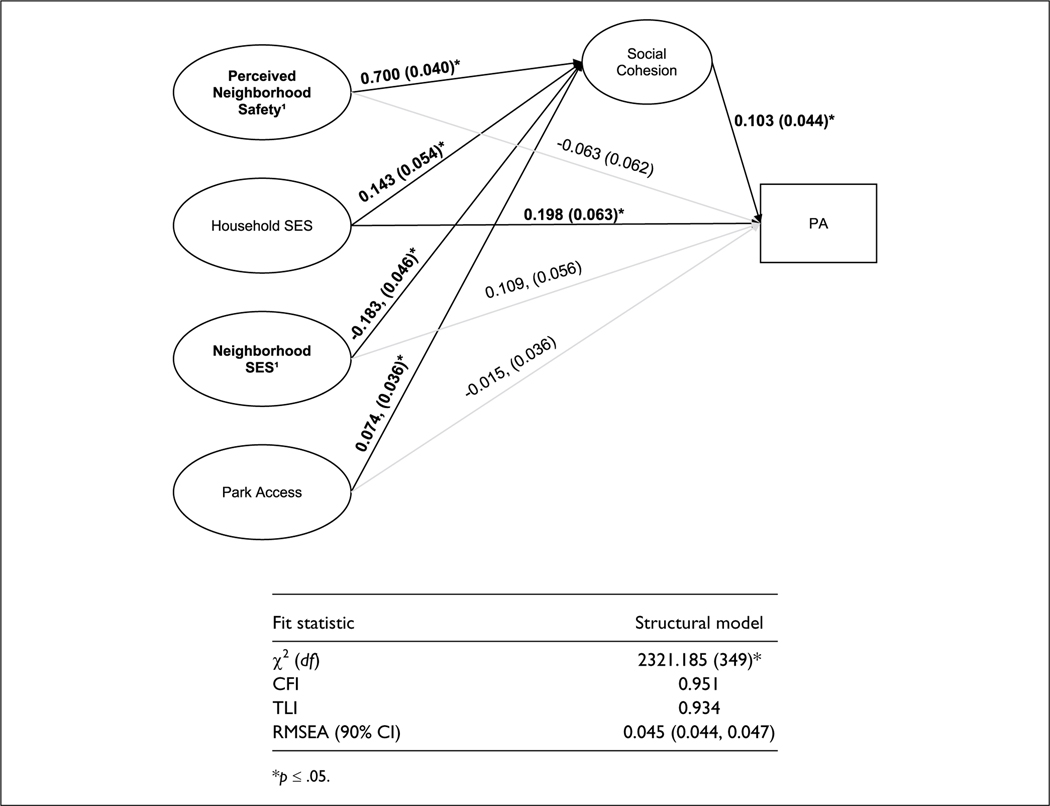
Figure 2.
Results of full structural equation model, showing standardized estimates.
Note. Covariates: Race/ethnicity, age, marital status, number of children in the home, depressive symptoms, obesity status.
*Black lines with asterisks indicate statistically significant paths, p ≤ .05. Grey lines indicate nonsignificant paths.
1The indirect pathway to PA is significant (p ≤ .05) indicating the relationship is fully mediated by social cohesion.

