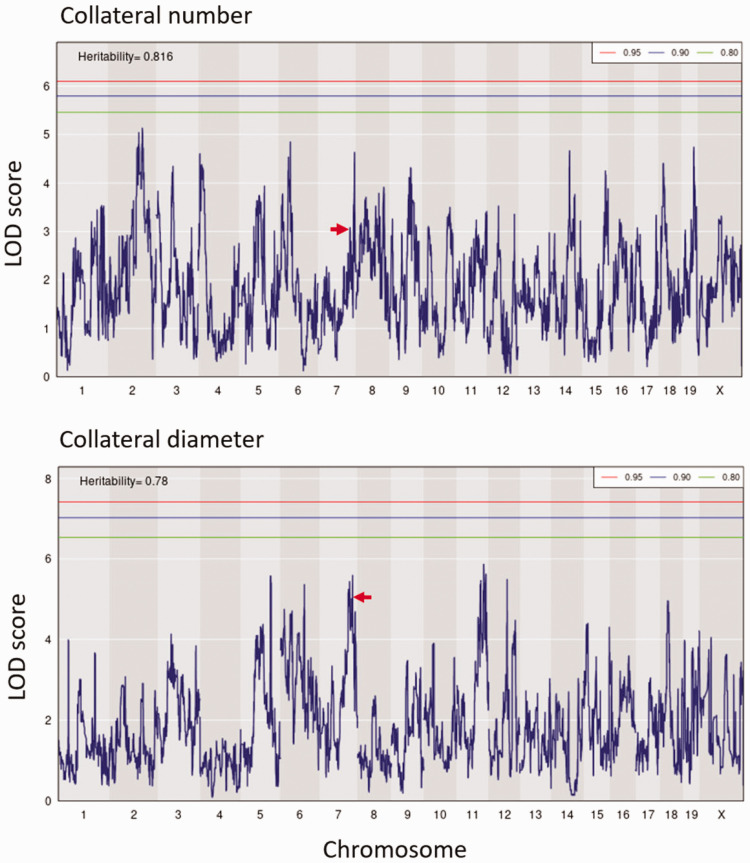
Figure 3.
QTL mapping of collateral number and diameter in CC mice. LOD plots show the genomic position of QTL peaks for collateral number and diameter data in Figure 1. Relative chromosome length is shown by shading across the abscissae. Thresholds are for genome-wide significance based on 1000 permutations in this and subsequent figures. Six peaks exceed LOD 4.5 for number and 6 for diameter (see also “Data for QTL for collateral number with LOD > 4.5 shown in Figure 3” in Supplement); none is centered on the same marker SNP for both traits. Red arrows, peaks coincide with location of Rabep2.

