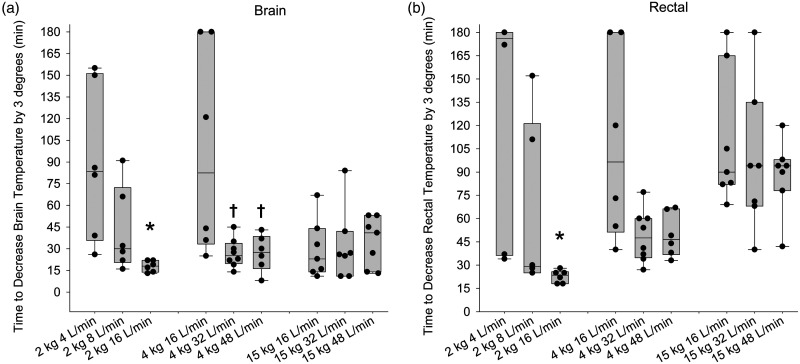
Figure 5.
Dependence of rate of cooling on nasal airflow rate. Box-whisker plots display the duration of nasal airflow at which brain temperature (a) and rectal temperature (b) decreased by 3°C from baseline in 1.8-kg piglets with airflows of 4, 8, or 16 L/min and in 4-kg and 15-kg piglets with airflows of 16, 32, or 48 L/min. *P < 0.05 from 1.8-kg piglets with 4 L/min; †P < 0.05 from 4-kg piglets with 16 L/min airflow by analysis of ranks.

