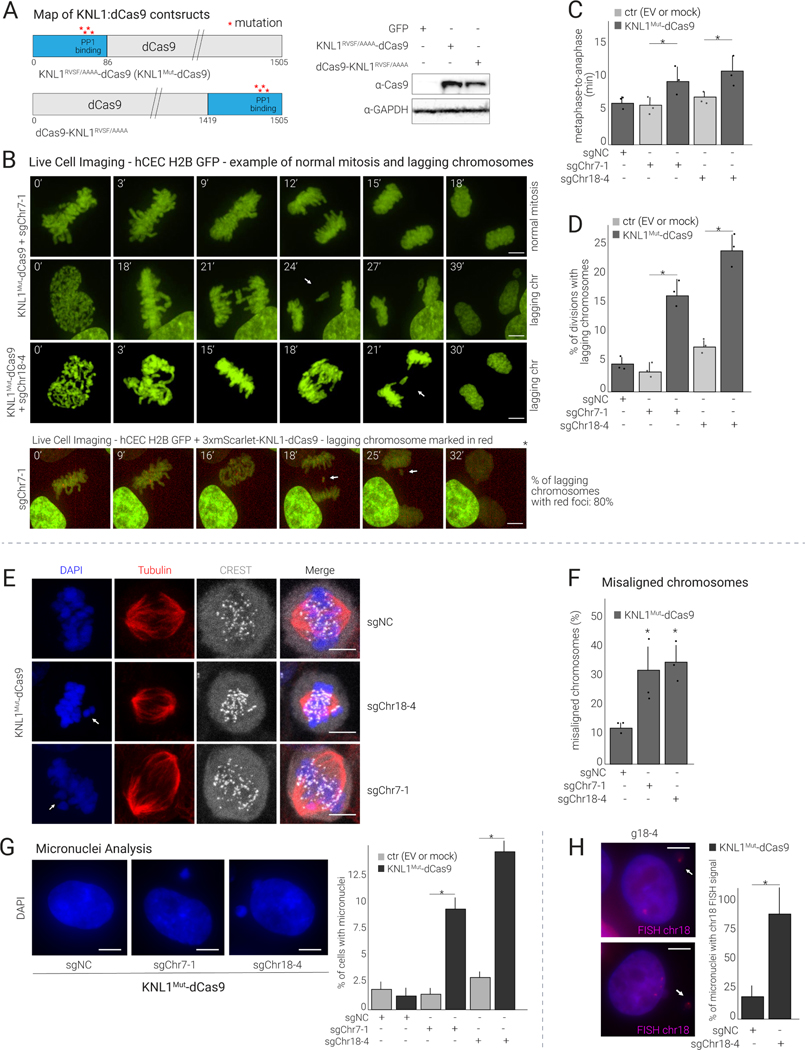
Figure 2.
KNL1Mut-dCas9 targeted to centromeres induces modest mitotic delay and chromosome missegregation
(A) Left: Maps of KNL1RVSF/AAAA-dCas9 and dCas9-KNL1RVSF/AAAA constructs. Right: Western blot showing the expression of the indicated constructs in hCECs.
(B) Top: Time-lapse imaging of hCECs expressing H2B-GFP, KNL1Mut-dCas9, and the indicated sgRNA. Cells were analyzed for time spent in mitosis and for lagging chromosomes (quantified in C and D), and representative images are shown (see Movies S1 for time-lapse series). Bottom: Analysis performed in H2B-GFP hCECs co-expressing 3xmScarlet-KNL1Mut-dCas9 and sgChr7–1, indicating specific chromosome missegregation.
(C) Quantification of mitotic duration (time spent between metaphase and anaphase onset) of cells in (B) (mean and S.D. from triplicates; ≥25 dividing cells analyzed per condition).
(D) Quantification as in (C) reporting % of mitoses showing lagging chromosomes.
(E) Immunofluorescence (IF) analysis of mitotic HCT116 cells expressing KNL1Mut-dCas9 and sgChr7–1 or sgChr18–4 or sgNC stained as indicated. White arrows point to misaligned chromosomes.
(F) Quantification of chromosome congression defects in (E) (mean and S.D. from triplicates).
(G) Analysis of micronuclei in hCECs expressing KNL1Mut-dCas9 and sgChr7–1, sgChr18–4, or sgNC. The percentage of cells with micronuclei relative to EV was determined 7 days after transduction (mean and S.D. from triplicates; ≥50 cells per condition).
(H) Representative images and quantification of chr-18-containing micronuclei in cells treated as in (G), from triplicate experiments.

