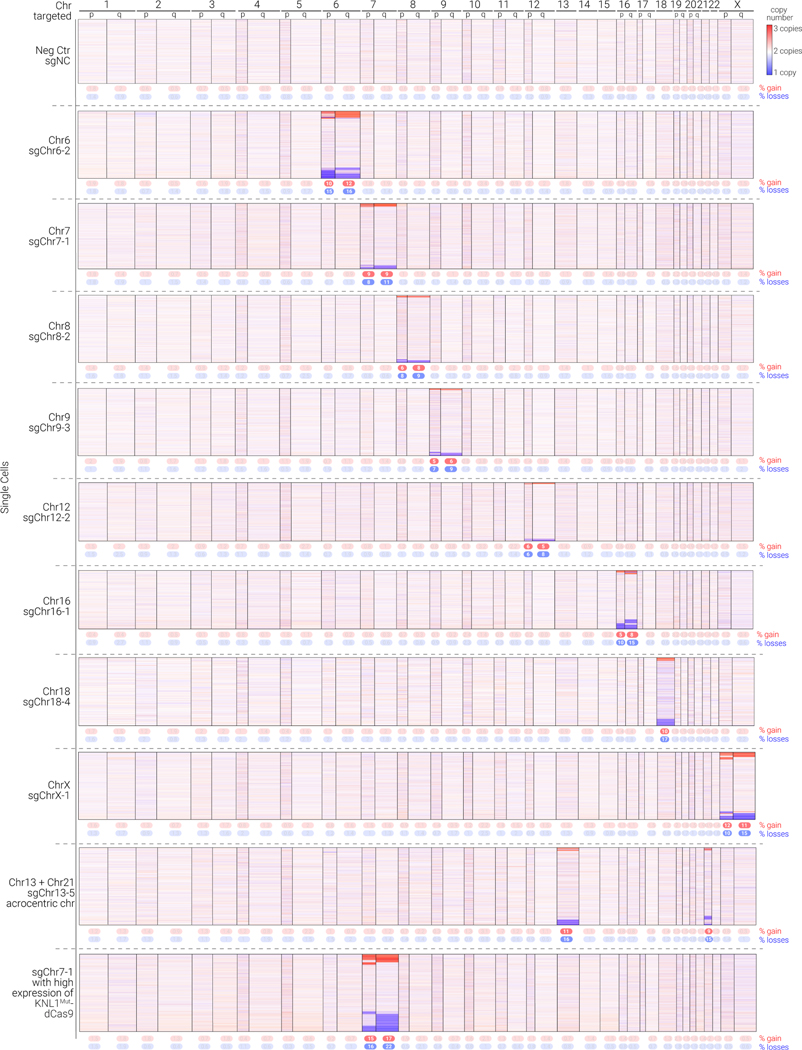
Figure 4.
KaryoCreate induces both arm-level and chromosome-level gains and losses across different human chromosomes
Heatmap depicting arm-level copy numbers inferred from scRNA-seq analysis in KaryoCreate experiments using the indicated sgRNAs. scRNA-seq was used to quantify the presence of chromosome- or arm-level gains or losses using a modified version of CopyKat (see Methods). Rows represent individual cells, columns represent chromosomes, and colors represent gains in red and losses in blue. ‘Higher expression of KNL1Mut-dCas9’ indicates that the cells were transduced with a larger amount of the construct (as in Fig. S3D). See also Table S3 for quantification of arm- and chromosome-level events.

