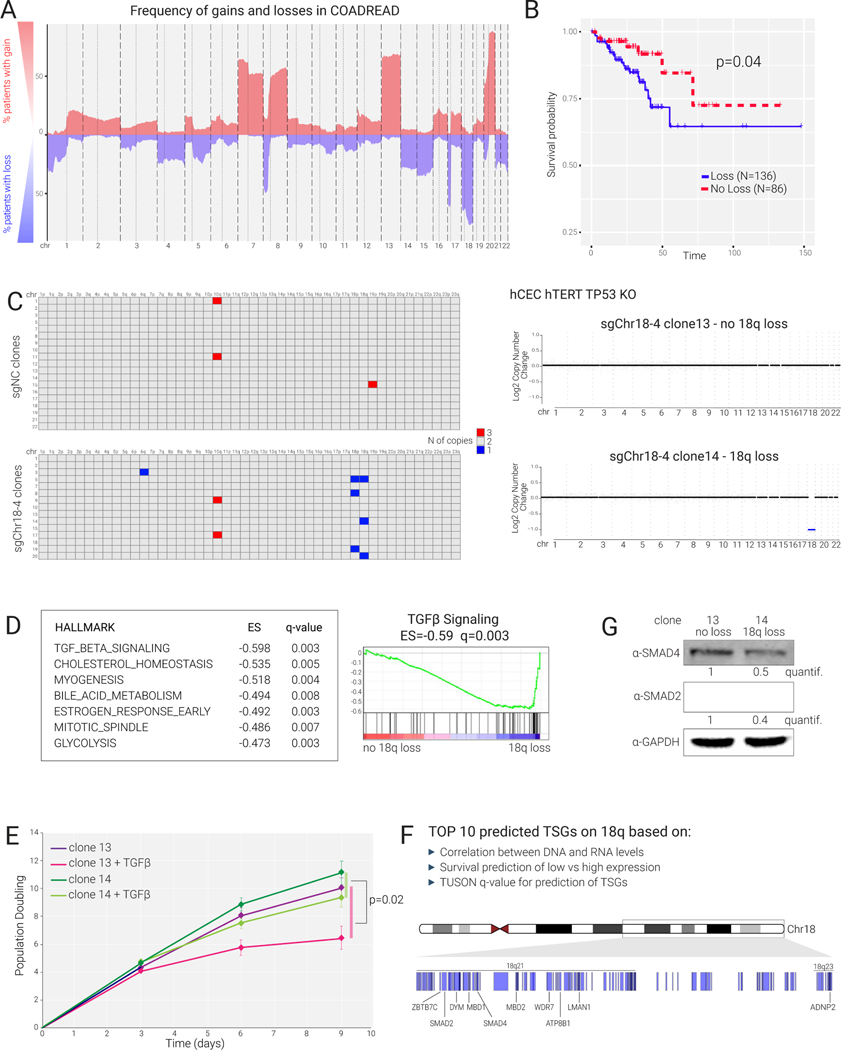
Figure 5.
Loss of 18q in colon cancer cells promotes resistance to TGFβ signaling
(A) Frequency of copy number alteration in colorectal cancer (TCGA) indicated as percentage of patients with gain or loss for each chromosome.
(B) Kaplan-Meier survival analysis for colorectal cancer patients (TCGA) displaying or not displaying 18q loss (N=number).
(C) Left: Shallow WGS analysis of single-cell-derived clones obtained by KaryoCreate using sgNC or sgChr18–4 performed on diploid hCECs to identify arm-level gains and losses. Each row represents a single clone. Right: Plots of copy number alterations from WGS of two representative clones treated with sgChr18–4.
(D) Bulk RNA-seq showing differential expression analysis between clone 14 (18q loss) and clone 13 (diploid) using DESeq2 and GSEA (performed using the Hallmark gene sets); the top 7 pathways depleted in clone 14 are shown, including TGFβ signaling as the top depleted one.
(E) Effects of TGFβ (20 ng/ml) on clone 13 and 14 growth monitored for 9 days. Cells were counted every 3 days in quadruplicates. p-value is from Wilcoxon test comparing the difference in cell number between treated and untreated clone 14 cultures versus the same difference calculated for clone 13 cultures.
(F) Top 10 predicted tumor-suppressor genes (TSG) on 18q and their genomic locations. TSG were predicted based on the correlation between DNA and RNA levels, survival analysis, and TUSON-based q-value for the prediction of TSGs4 (see Methods).
(G) Western blot analysis for SMAD2, SMAD4, and GAPDH (as control) in clones 13 and 14. Quantification of SMAD2/SMAD4 levels after normalization against GAPDH.

