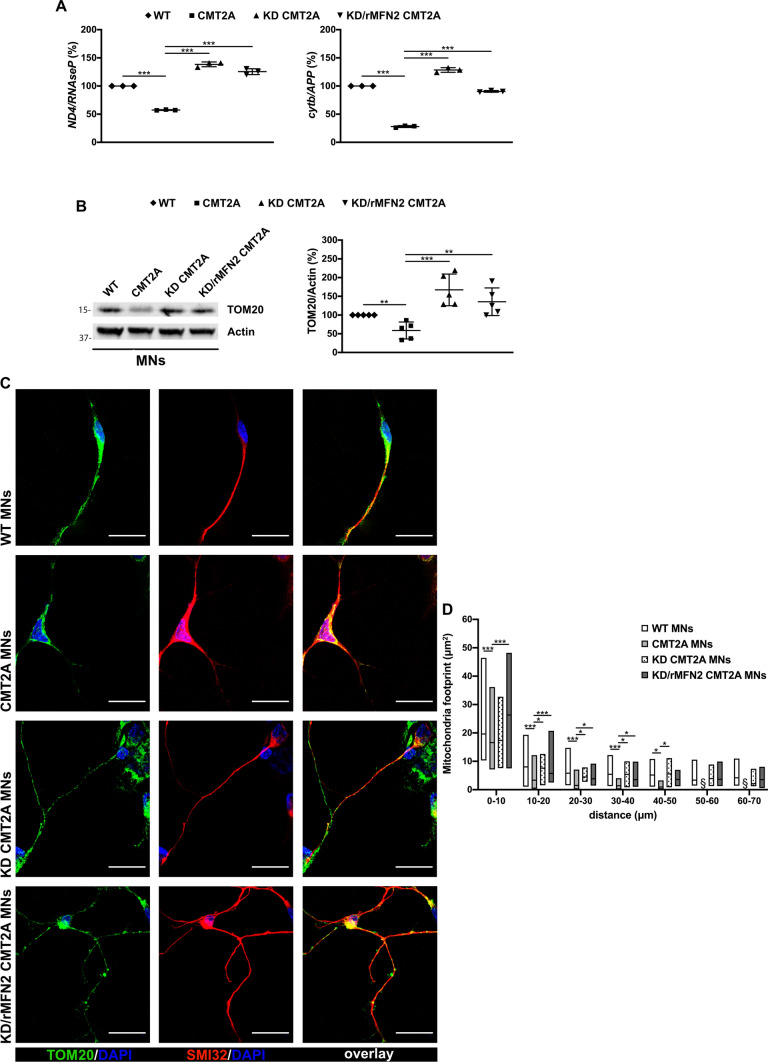
Fig. 3.
Reduced mitochondrial content and altered mitochondrial distributions were rescued after combined RNAi/gene therapy in CMT2A MNs. A Quantitative PCR analysis of human mitochondrial genes (ND4 and cytb) and nuclear genes (RNAseP and APP) in WT, CMT2A, KD-CMT2A, and KD/rMFN2-CMT2A MNs. Error bars indicate SEM of ND4/RNAseP and cytb/APP: ***P < 0.001, one-way ANOVA. B Representative Western blot analysis of the mitochondrial protein TOM20 in WT, CMT2A, KD-CMT2A, and KD/rMFN2-CMT2A MNs. Error bars indicate SEM of TOM20/actin expression. **P < 0.01, ***P < 0.001, one-way ANOVA. C Representative images of WT, CMT2A, KD-CMT2A, and KD/rMFN2-CMT2A MNs labeled with TOM20 (red) and SMI32 (green). Images were acquired using a Leica TCS SP5 confocal microscope at 63 × magnification. Nuclei were labeled with DAPI (blue). Scale bar: 25 µm. D Quantification of the mitochondrial area (µm2) in the four different MN cultures. Box plots show the median (horizontal lines) and the minimum and maximum (box) values. Multiple Student’s unpaired t-test; *P < 0.05, ***P < 0.001 from 0 to 50 µm; § undetectable fluorescence; n = 30 for WT-MNs, n = 48 for CMT2A MNs, n = 13 for CMT2A-KD MNs, and n = 45 for KD/rMFN2-CMT2A MNs in two independent experiments

