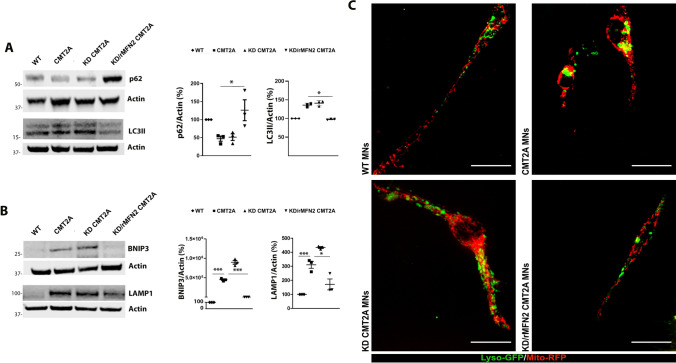
Fig. 4.
Combined RNAi/gene therapy reduced the impairment in the mitophagic flux in CMT2A MNs. A Western blot analysis of p62 and LC3-II in WT, CMT2A, KD/rMFN2-CMT2A, and KD-CMT2A MNs. Error bars indicate SEM of p62/actin and LC3-II/actin expression. *P < 0.05, one-way ANOVA. B Western blot analysis of BNIP3 and LAMP1 in WT, CMT2A, KD/rMFN2-CMT2A, and KD-CMT2A MNs. Error bars indicate SEM of BNIP3/actin and LAMP1/actin expression. ***P < 0.0001, *P < 0.05, one-way ANOVA. C Lysosome (green) and mitochondria (red) localization in WT, CMT2A, KD/rMFN2-CMT2A, and KD-CMT2A MNs. The yellow signal indicates the overlapping of lysosomes and mitochondria. Images were acquired using a Nikon ECLIPSE Ti/CREST microscope at 60 × magnification with spinning disk. Scale bar: 25 µm. Two independent experiments included n = 11 for WT-MNs, n = 10 for CMT2A MNs, n = 9 for CMT2A-KD MNs, and n = 8 for KD/rMFN2-CMT2A MNs

