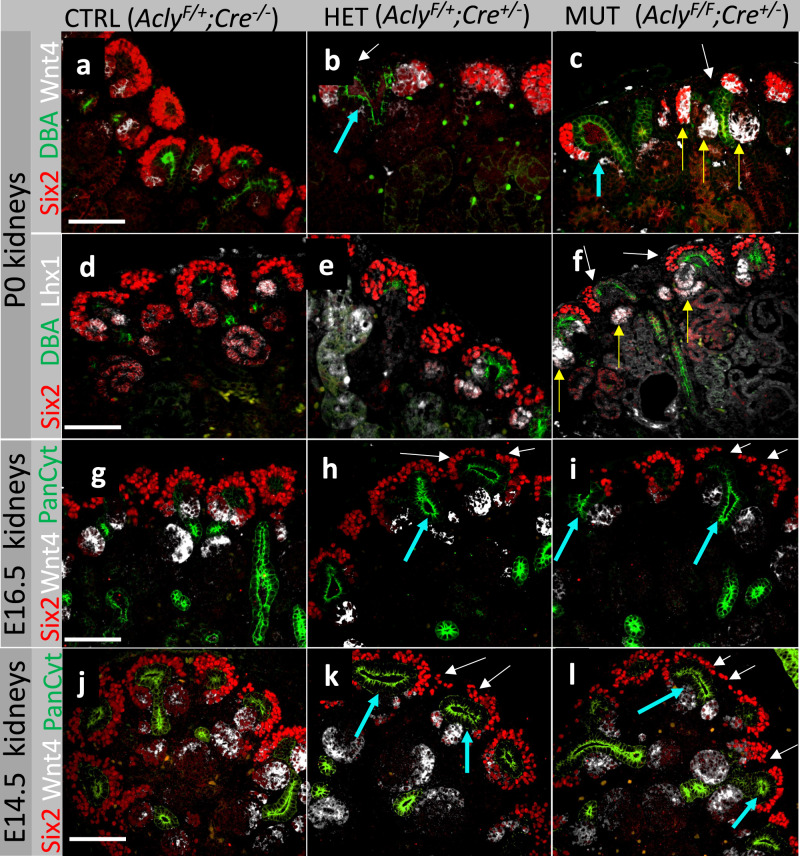
Fig. 8. Molecular characterization of developmental defects resulting from ablation of Acly in Six2+ cells.
Visualization of nephrogenic niches of control kidneys (a, d), heterozygous (b, e), and mutant kidneys (c, f) at P0. E16.5 kidneys are displayed as control kidneys (g), heterozygous (h), and mutant kidneys (i). E14.5 kidneys are shown as control kidneys (j), heterozygous (k), and mutant kidneys (l) Cyan arrows point to dilated UB ampullae; white arrows show areas with depleted cap-mesenchyme; yellow arrows show expansion of Wnt4 towards the cap-mesenchyme. Five embryonic kidneys per genotype per stage were used in this experiment. Embryos from at least two distinct litters per stage and genotype were sectioned and stained. Scale bar 100 µm.

