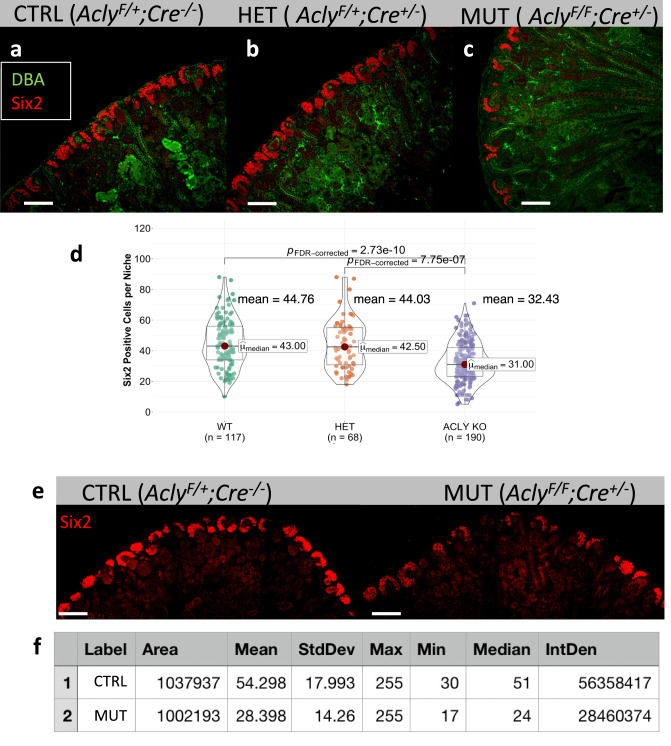
Fig. 9. Deletion of Acly in Six2+ cells resulted in depletion of CM and reduction in Six2 protein abundance at P0.
P0 control (AclyF/;Cre-/-), heterozygous (AclyF/+;Cre+/-), and mutant kidney (AclyF/F;Cre+/-), stained with DBA (green), Six2 (Red) merged a–c Quantification of Six2 positive cells per niche was performed by counting all Six2+ cells in each niche. Notice a statistically significant reduction of Six2+cells detected in mutant kidneys compared to control and heterozygous kidneys, number of niches counted is depicted, center lines with maroon dot denote medians, mean values are placed in the figure, box limits indicate the 25th and 75th percentiles, and whiskers extend to the minimal and maximal values (d). Selection of Six2 immunofluorescence signal of control and mutant kidneys within a similar area and the number of niches, roughly 20 (e). Quantification of fluorescence intensity shown in E, area, mean intensity, min, max values, and median are shown (f). Kruskal-Wallis test was performed across groups, global p-value = 5.70e−12, n = 375 observations. The pairwise comparison was performed with the Dunn test, significant p-value < 0.05. FDR-corrected values are presented in the figure. Scale bar 200 µm. Source data are provided as a Source Data file.

